The previous section looked at the many ways patient, iterative work by engineers exponentially improves the price, power and size of technology.
While vast, the previous categories of improvement are, each on their own, obvious, quantifiable, predictable in scale, if not precise time-frame. Each can be easily graphed on standard log paper.
The only unprecedented feature of the current technology environment — versus Moore’s law and other previous formulations of manufacturing improvements — is that all the exponential forces working together will move the log base will itself be 1 million (or 1 billion?) rather than the current base of 10 or 100.
Technology is a constantly improving magic lamp that fulfills consumers’ commands. But we also need to remember that technology alters consumers and their needs; rubbing the lamp summons a new Aladdin.
Which brings us the most important two categories of improvement — weird, wild and unchartable change that’s a constantly mutating hybrid of human desires and technical capacity.
Feedback loops and iteration will lead us to multiple new dimensions of utility, for which graph pages don’t currently exist, metrics aren’t invented, textbooks haven’t yet been written. These changes will be, quite literally, “off the charts.”
Again, the mechanism driving these changes is simple but nearly invisible, because we’re each personally immersed in them every day as technology users. Consumers demand both more (power, speed, utilities, functions) and less (size, cost, complexity.) Sometimes requests are incremental (I wish this phone fit in my skinny jeans!), sometimes come in sideways hops (couldn’t you add a UV sensor to this smartwatch?) and sometimes leapfrog forward or upward beyond what’s currently imaginable because precedential, intermediate steps haven’t yet been built (why can’t I predict my SAD-quotient in January versus my maternal grandmother’s cummulative sunlight consumption during her pregnancy with my mother?)
Where does all this lead? We’re surrounded by transitions in daily life. Snow avalanches, personal relationships bloom or die, a puddle of molecules snaps into a sheet of crystals. Writing in the early 19th century just as science was emerging as a profession, the German historian GFW Hegel was the first to articulate that small changes in quantity in an organism or social group sometime trigger qualitative leaps. Herds stampede. Markets collapse. Gradually add neurons to a brain, agitate for a million years, and you get Beowulf in a mead hall, then, 1000 years later, a 160-story tower in the desert.
Unlike the the changes listed above — all of which can be simply quantified by adding more zeros to an existing number — it’s impossible to know where this category of change leads. This category of change goes against everything we learned in first grade, but 1+1+1+1 sometimes equals 6, particularly when each individual unit can affect others (or subgroups of units.) Economists and scientists call this phenomena emergence. Nuclear engineers talk about critical mass or a meltdown. Sociologists talk about tipping points.
Accelerating the supply/demand feedback loop beyond what was seen in pre-1990 innovation cycles, today’s technology change is magnified, diversified and nichified by networked demand.
In most populations, online sharing is the domain of outliers, geeks and extroverts, but Pew Internet has found that 1 in 4 people “among those living with chronic disease, those who are caring for a loved one, and those who have experienced a significant change in their physical health” was looking online to peers for information and support.
More of more: devices, precision, data, users, and software
To be clear, I’m not claiming that any of the genetic data or analysis above is close to 100% accurate. Or that I know what all the numbers mean. Or that the results are in any way currently actionable — unless you’re considering asking me out on a date. (And I’m not saying genetic data can be life-changing, now or maybe ever, for the average person. Though a few genes have well defined outcomes, most of the inputs for an individual’s phenotype — your body, your health — are far, far, far beyond computable. This is primarily because a) genes are extensively multivariant and entwined and (some even varying based on inheritance from mother vs father) b) environmental inputs exceed both our (current) ability and (longterm?) tolerance for tracking.)
What I am arguing is that technology history indicates that those potential qualms are irrelevant. Genetic testing’s breadth, accuracy and accessibility will (in some combination) improve exponentially — at least 10,000-fold — in the coming 20 years. More importantly, many other categories of health devices and services are on the same trajectory.
10,000 times?
That sounds like ayahuasca-chugging, tech-utopian, Theranosian hyperbole, but it’s a tried-and-true formula.
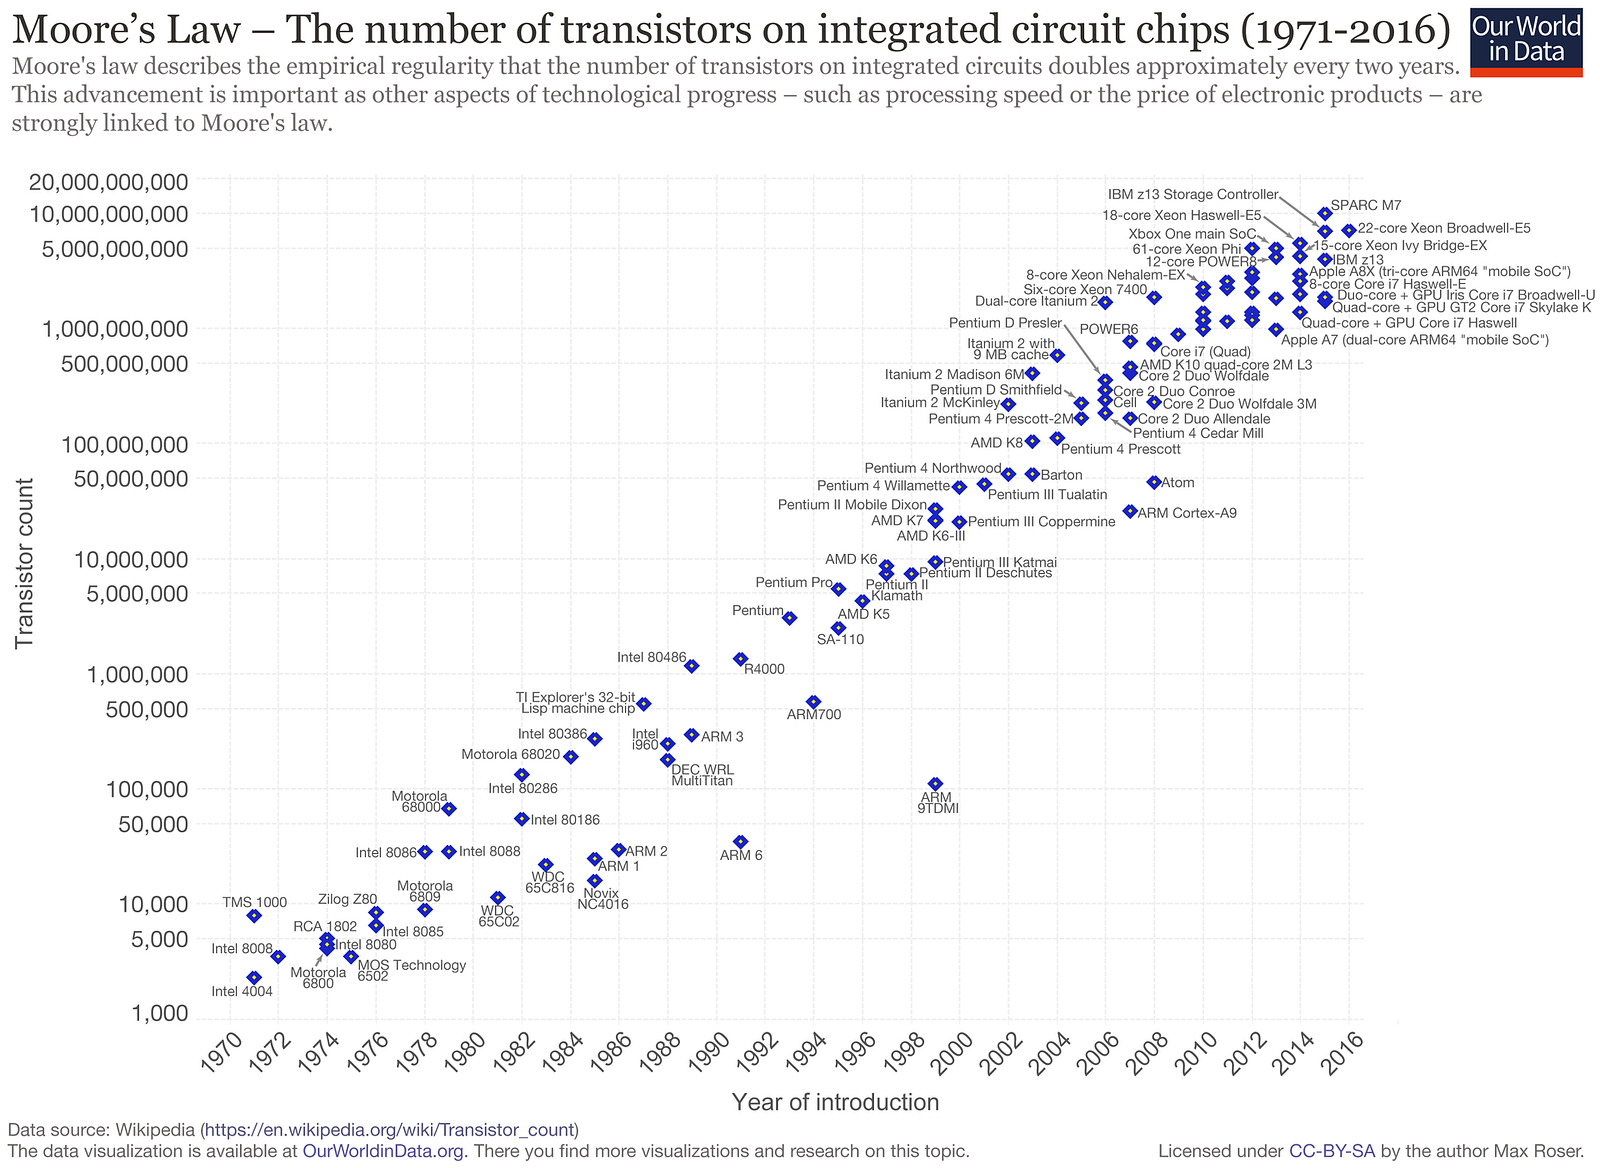
Over the last fifty years, computers have relentlessly improved — in a mix of power, price per unit and form factor — by a factor of 100 each decade or so. What was dubbed Moore’s Law in 1965 to describe computer chip density has become every tech CEO’s rallying cry.
100 X per decade is, over two decades, 10,000-fold change.
Formulated in 1965, “Moore’s law” was the first of many exponential trendlines identified in technology. (Source: OurWorldinData.org)
Living amid the constant day-to-day change, gripping and gripped by our devices, it’s almost impossible to pull back far enough to see the magnitude of what’s happening around us. Change has become a constant. Its blur is the wallpaper of our lives.
At the cost of billions of dollars, one person’s genome was first sequenced with 99% accuracy in 2003. In 2006, it cost $300,000 to decode one person’s entire genome, which is roughly 4,000 X what 23andMe currently processes. By 2014, that cost had dropped to $1,000, and $100 in sight.
It’s easy to forget (in fact, half today’s population never knew) that early “pocket calculators” cost roughly $150 — $900 today’s dollars — when they were first popularized in the early ’70s. Today, $900 would buy 100,000,000 times more computing power in a piece of polished hardware that doubles as a phone and a pro-grade camera, not to mention providing access to tens of thousands of functions and services ranging across spreadsheets, videos, gif-makers, IM, tax preparation, heart rate data, music, and, yes, access to your own detailed genetic data.
While proverbial frog in the boiling pot experiences change along a single dimension, temperature, we’re experiencing at least seven types of change — often exponential improvements — in health technology. Though each type of change influences the others, they’re also roughly nested like a Russian doll, each layer resulting from, building on and amplifying the ones it contains. I’ll summarize each of them briefly here, starting from the innermost…
1 Most simply, we’ll continue to see more categories of personal health devices, as lab-grade hardware shrinks in price, size and complexity to arrive on and in consumers’ hands, wrists, heads and pockets.
The same pattern will ricochet in and around the industry of medicine. To return to the airline analogy: in the next 20 years, today’s jumbo jets of healthcare will become 99.99% cheaper and faster, and will shrink enough to fit into your home.
Blood sugar monitors, an early example of consumer health device, is a good example of what’s happening across multiple types of devices. The first glucometer available to consumers, the Ames Reflectance Meter (ARM), cost $650 in 1970, roughly $4,225 in today’s cash. The ARM weighed 3 pounds and required a sequence of precise steps. In contrast, today’s glucometers weigh 3 ounces, costs $20–50, require just two steps, include data storage in the cloud, sometimes measure ketones too. Dozens are available for one day shipping on Amazon.com. Revenues from self-monitoring of glucose have been growing an average of 12.5% per year since 1980, even as prices have plummetted. (Slide 7 of this meticulous history of the evolution of glucometers records examples of the medical industry’s early hostility to patients who mused about testing their own gluclose levels.)
The types of consumer-owned devices that yield medically relevant data just keeps getting longer. These include:
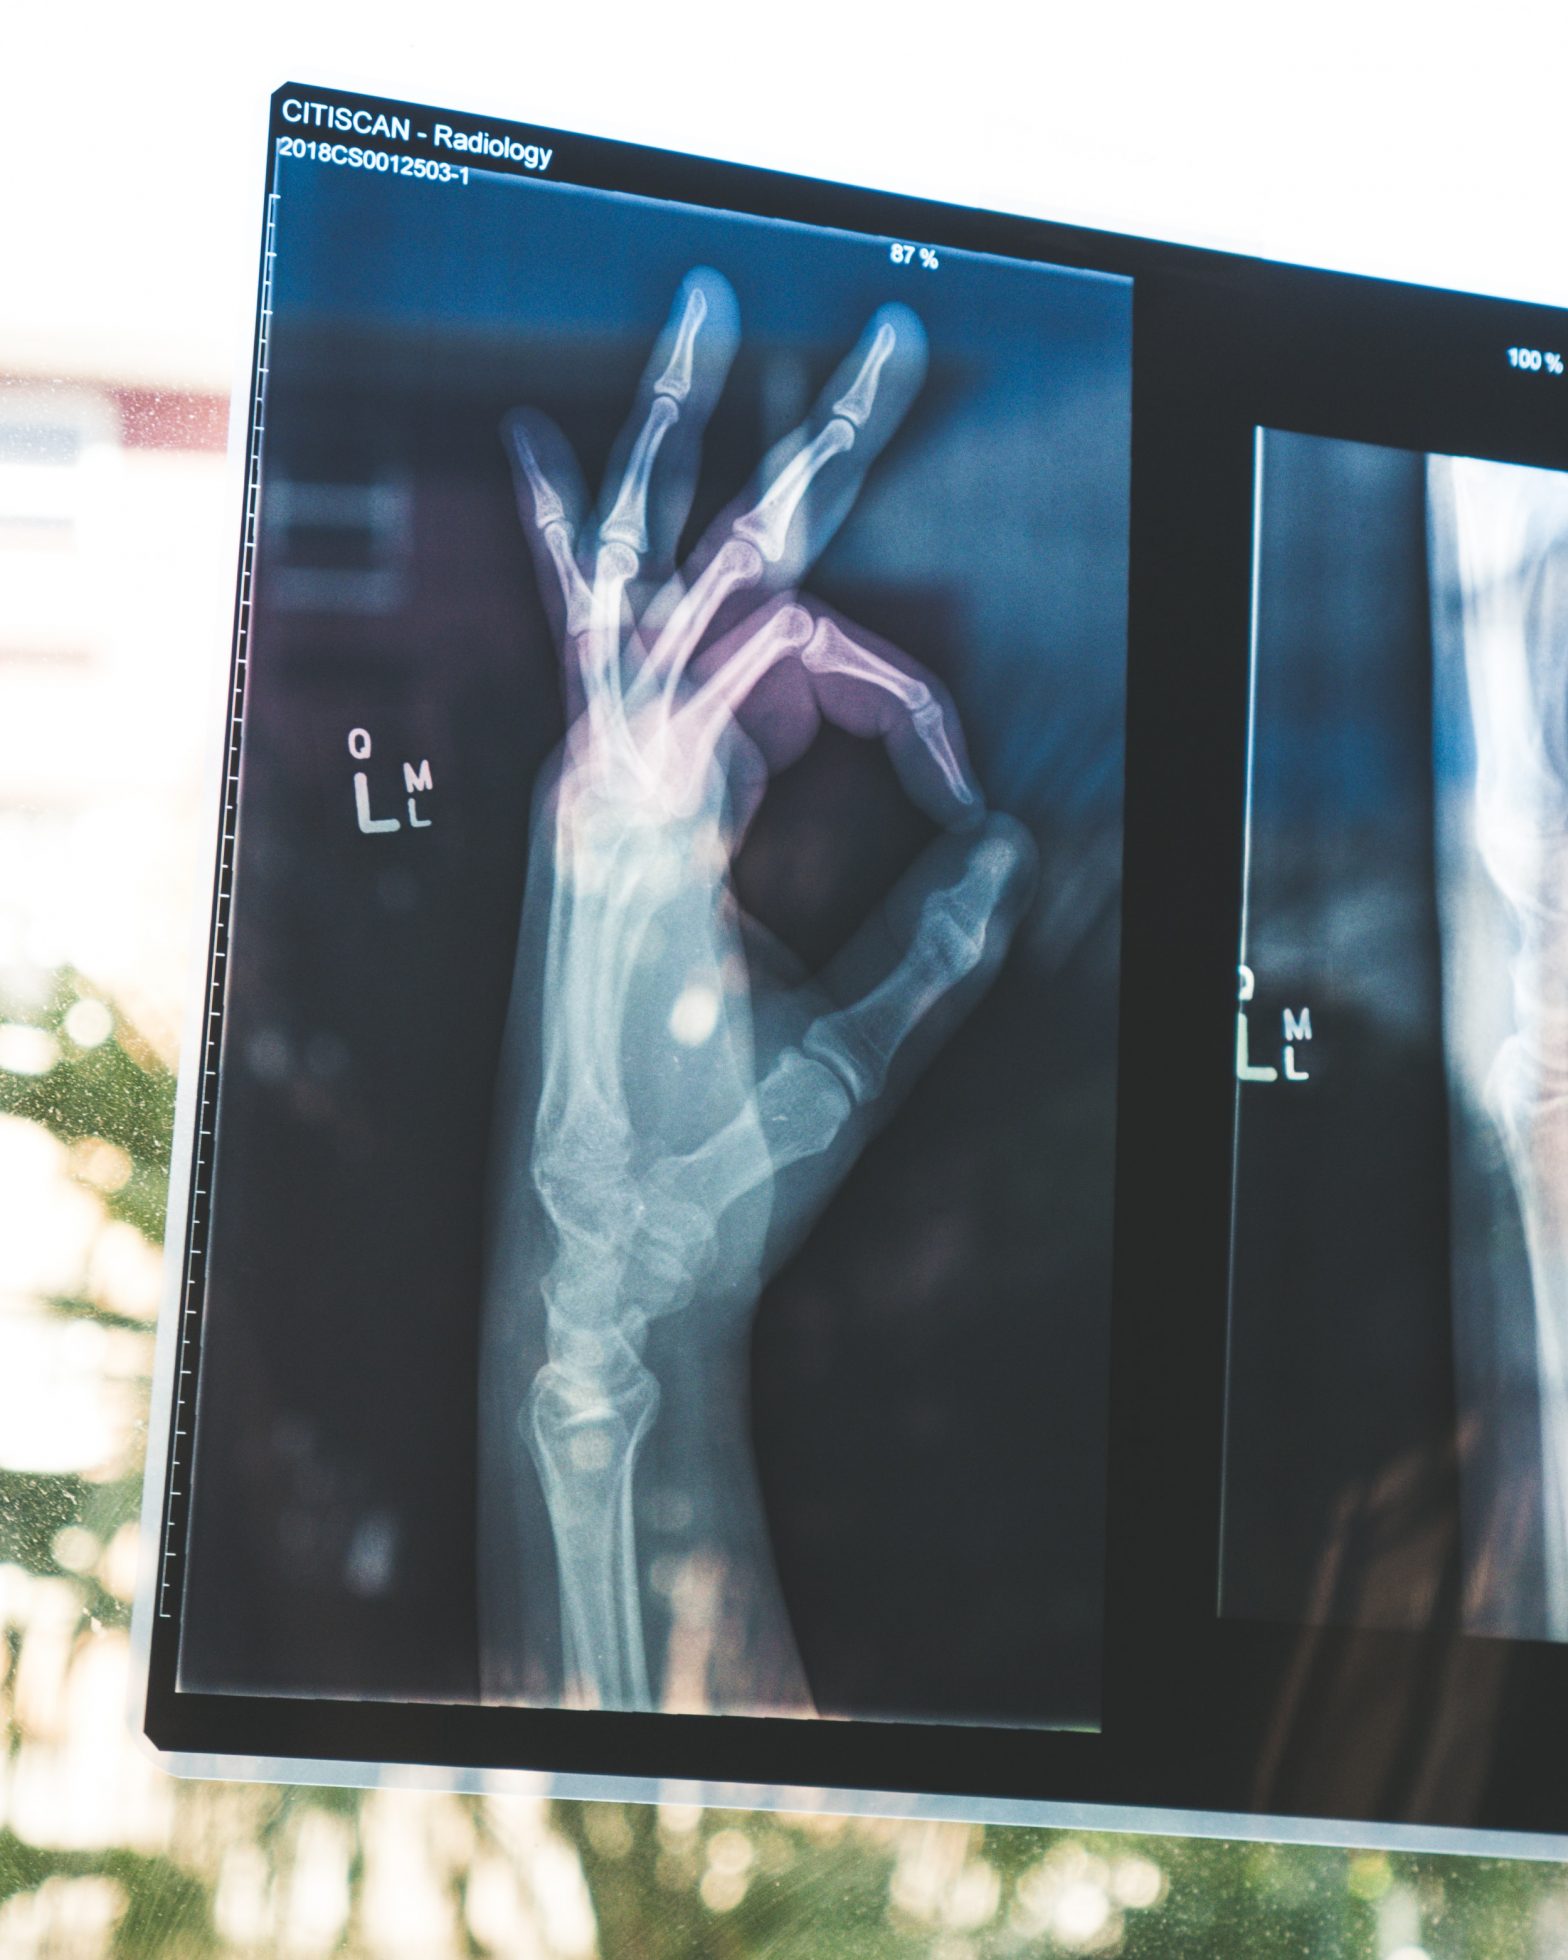
Though it will be a long time before the average consumer goes to BestBuy to shop for a CT scan machine for the rec room (much less, carries one in her pocket), compounding improvements will shrink the list of medical technologies that are today unique to hospitals, clinics, labs and doctors’ offices. (BTW, check out EBay’s 585 listings for CT scanners.)
2 These consumer-owned devices’ precision and frequency of measurement is constantly improving too.
Home glucose monitoring has graduated from five color variations (corresponding to 100, 250, 500, 1000, and 2000 mg/dL) to 0–600 digital scale that approximates lab results more than 95% of the time. (A fasting reading below 100 is normal, above 120 indicates diabetes.)
Then there’s heart rate monitoring. In 1983, photoplethysmography (PPG) was first deployed in a “relatively portable” table-top box plugged into the wall by aneasthesiologists to measure heart rate and blood oxygen levels. Today, a cordless 2 ounce version of the same $10–30 and can be used anytime. More importantly, for point (2), common fitness wearables generate numerous additional metrics — heart rate recovery, heart rate response, breathing rate, heart rate variability, cardiac efficiency, peak amplitude, perfusion variation — that are vital to gauging health (not to mention location and stride cadence.)
3 As the number of device types grows, and the precision and frequency of their measurements multiplies, data volumes will obviously grow exponentially. To put it very crudely, in comparson with a current pinprick sampling of a patient’s lifestream, in the coming decade, let’s guestimate that globally, in comparison to today:
5 times more people will own devices…
each person will use 2 to 3 devices…
each device will produce 1,000 times more data granularity…
doing 15 million times more sampling (for example, every 2 seconds versus, in some cases, once a year or exclusively during health crises)
Bear in mind that all those guesses are likely wrong… on the low side.
4 At the same time, the profusion of affordable consumer devices with wellness functions will lead to an explosion of consumption/utilization of health care data, both in the US and globally.
Or consider a healthcare challenge as massive but imperfectly served as diabetes, which a company called OneDrop is trying to address with a pay-per-month wrap-around solution that provides diagnostics, advice and prediction. OneDrop was conceived after its marathon-running founder learned, at 46, that he had Diabetes 1.
“I went to the doctor, got about six minutes with a nurse practitioner, an insulin pen, a prescription and a pat on the back, and I was out the door,” Mr. Dachis said. “I was terrified. I had no idea what this condition was about or how to address it.”
Feeling confused and scared, he decided to leverage his expertise in digital marketing, technology and big data analytics to create a company, One Drop, that helps diabetics understand and manage their disease.
The One Drop system combines sensors, an app, and a Bluetooth glucose meter to track and monitor a diabetic’s blood glucose levels, food, exercise and medication. It uses artificial intelligence to predict the person’s blood glucose level over the next 24 hours and even suggests ways the person can control fluctuations, such as walking or exercising to offset high sugar levels — or eating a candy bar to raise low glucose levels. Users can also text a diabetes coach with questions in real time.
Direct to consumer solutions will be even more revolutionary in healthcare deserts — regions or specialities where medical solutions are imperfect or absent. Examples include:
An estimated 35% of misdiagnoses by single physicians are wrong.
In China this year, after examining 600,000 case records, AI outperformed pediatricians with under 15 years of experience.
5 The final type of improvement, software innovation, is also hard to measure or graph because we don’t yet have units to quantify software “insight,” just speed, memory and accuracy. But this category is clearly important and predictable in direction and scale.
Some might argue that software upgrades are a lagging effect of hardware improvements, the output of programmers trying to keep up with speedier, more robust tech. In fact, software also appears to be improving exponentially, independently of hardware. The claim that software changes are exponential is highly speculative , but I can point to some of the nuts and bolts of what’s happening.
The first is a profile of Google’s two most senior programmers — 11s when everyone else at Google is ranked on a scale of 1 to 10 — and how they spearheaded ‘several rewritings of Google’s core software that scaled the systems capacity by orders of magnitude.’ One project led to Hadoop, which powers cloud computing for half the Fortune 50. (At the National Security Agency, Hadoop accelerated an analytical task by a factor of 18,000 and completely transformed the NSA’s approach to data gathering.) One of the pair, Jeff Dean, today leads Google Brain, the company’s flagship project for all things AI… which powers champion chess software AlphZero.
In 1997, when IBM’s Deep Blue beat Gary Kasparov, chess software was designed to emulate grandmasters’ heuristics and then sift through massive potential scenarios to see which would play out best. In contrast, today’s newest chess software, AlphaZero, taught itself how to play chess in just hours, then thrashed Stockfish 8, the world’s then reigning chess program. AlphaZero plays with strategies that sometimes mirrors grandmaster heuristics, but at other times, vastly surpass them. Yet again, we’re seeing exponential scaling: First, “AlphaZero also bested Stockfish in a series oftime-oddsmatches, soundly beating the traditional engine even at time odds of 10 to one.” Why? “AlphaZero normally searches 1,000 times fewer positions per second (60,000 to 60 million), which means that it reached better decisions while searching 10,000 times as few positions.”
Qualitatively, we’re witnessing chess that humans previously couldn’t even imagine. One game, in which AlphaZero sacrificed seven pawns to win, was described as “chess from another planet.”
23andme rolled out a new type 2 diabetes report this month that’s revolutionary.
Previously, 23andme results told the average person obvious things like that she/he does, indeed, have blue eyes and dimples. They also made it easier to find unknown relatives.
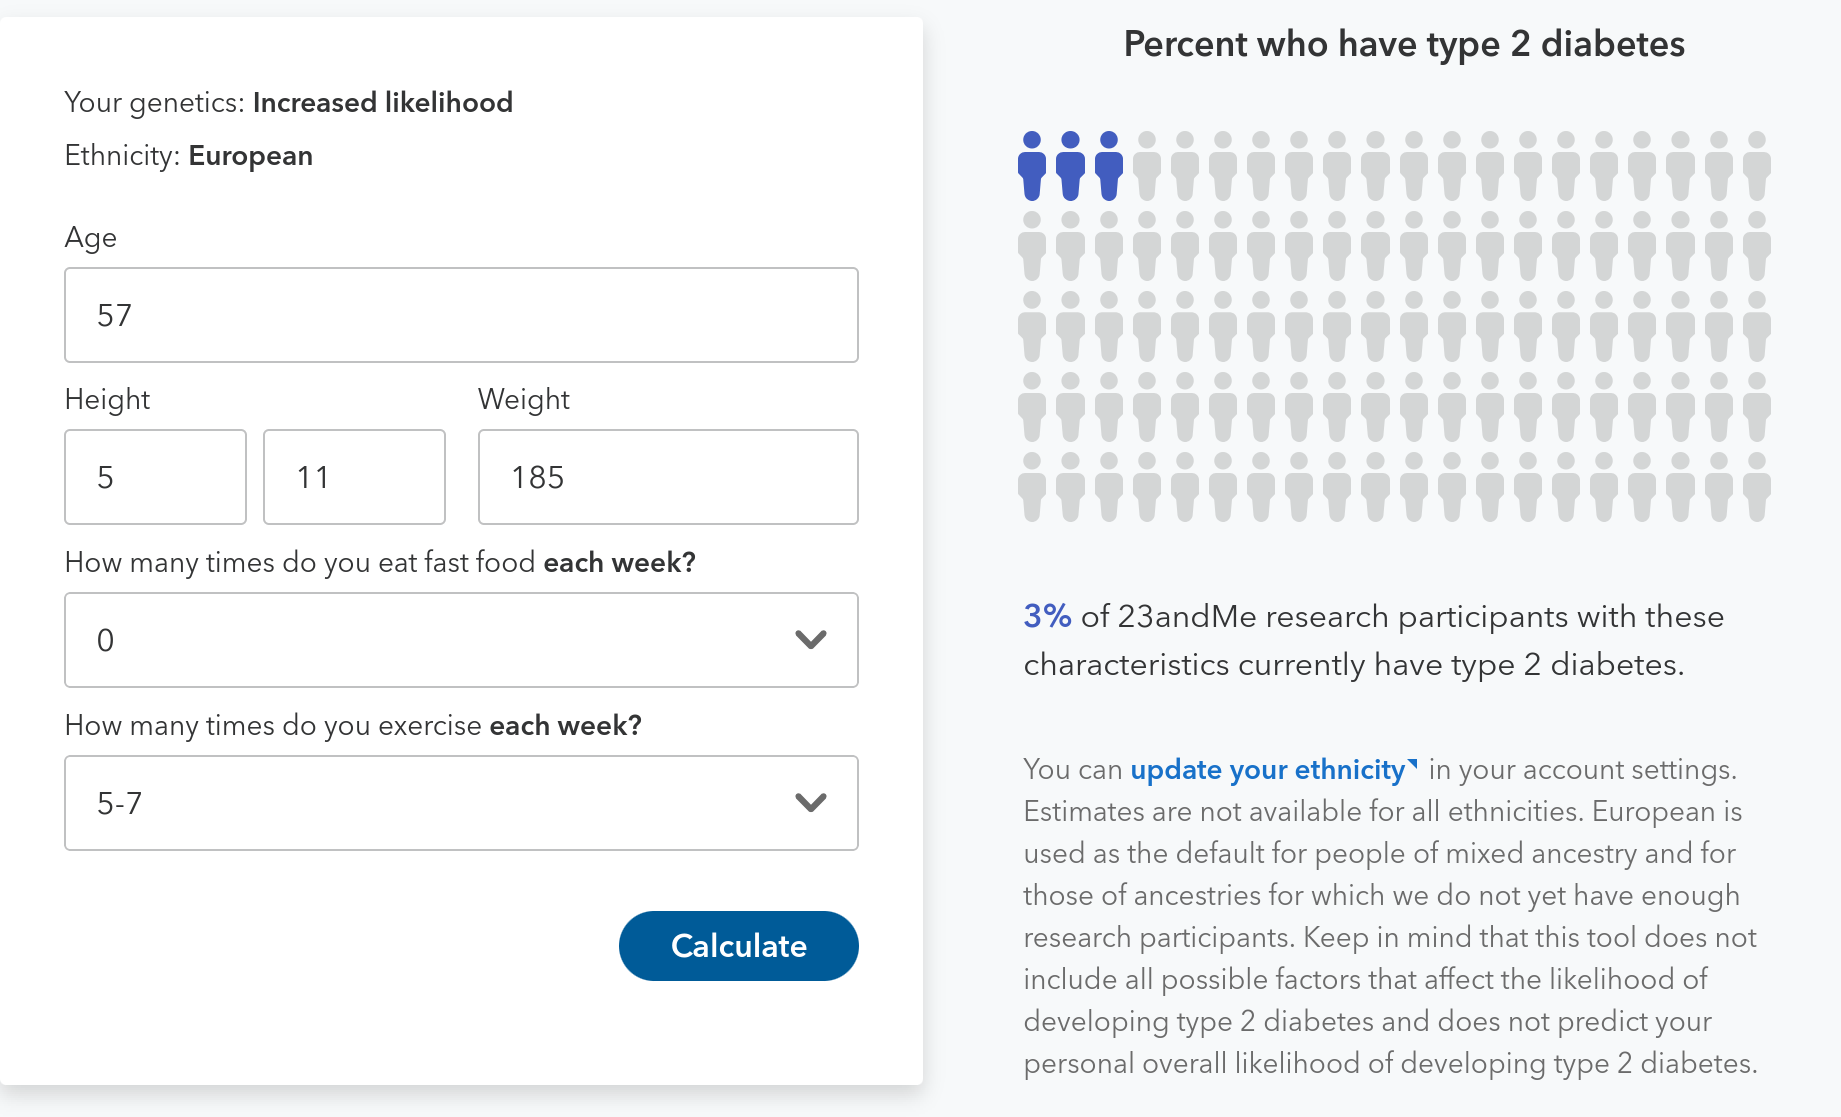
The new analysis goes a lot further — it quantifies your risk of type 2 diabetes based on your genes. My are higher than average.
The report goes a lot further, though. Thanks to survey respones submitted by other 23andme users, the report illustrates exactly how food and exercise choices impact my personal risk.
No longer is “eat less crud, exercise more” a vague thing your doctor mumbles when you see him/her every 18 months. Now the impact of daily lifestyle choices is quantified, clear and personal. As one personal commented on Facebook, “this is a smack in your face.”
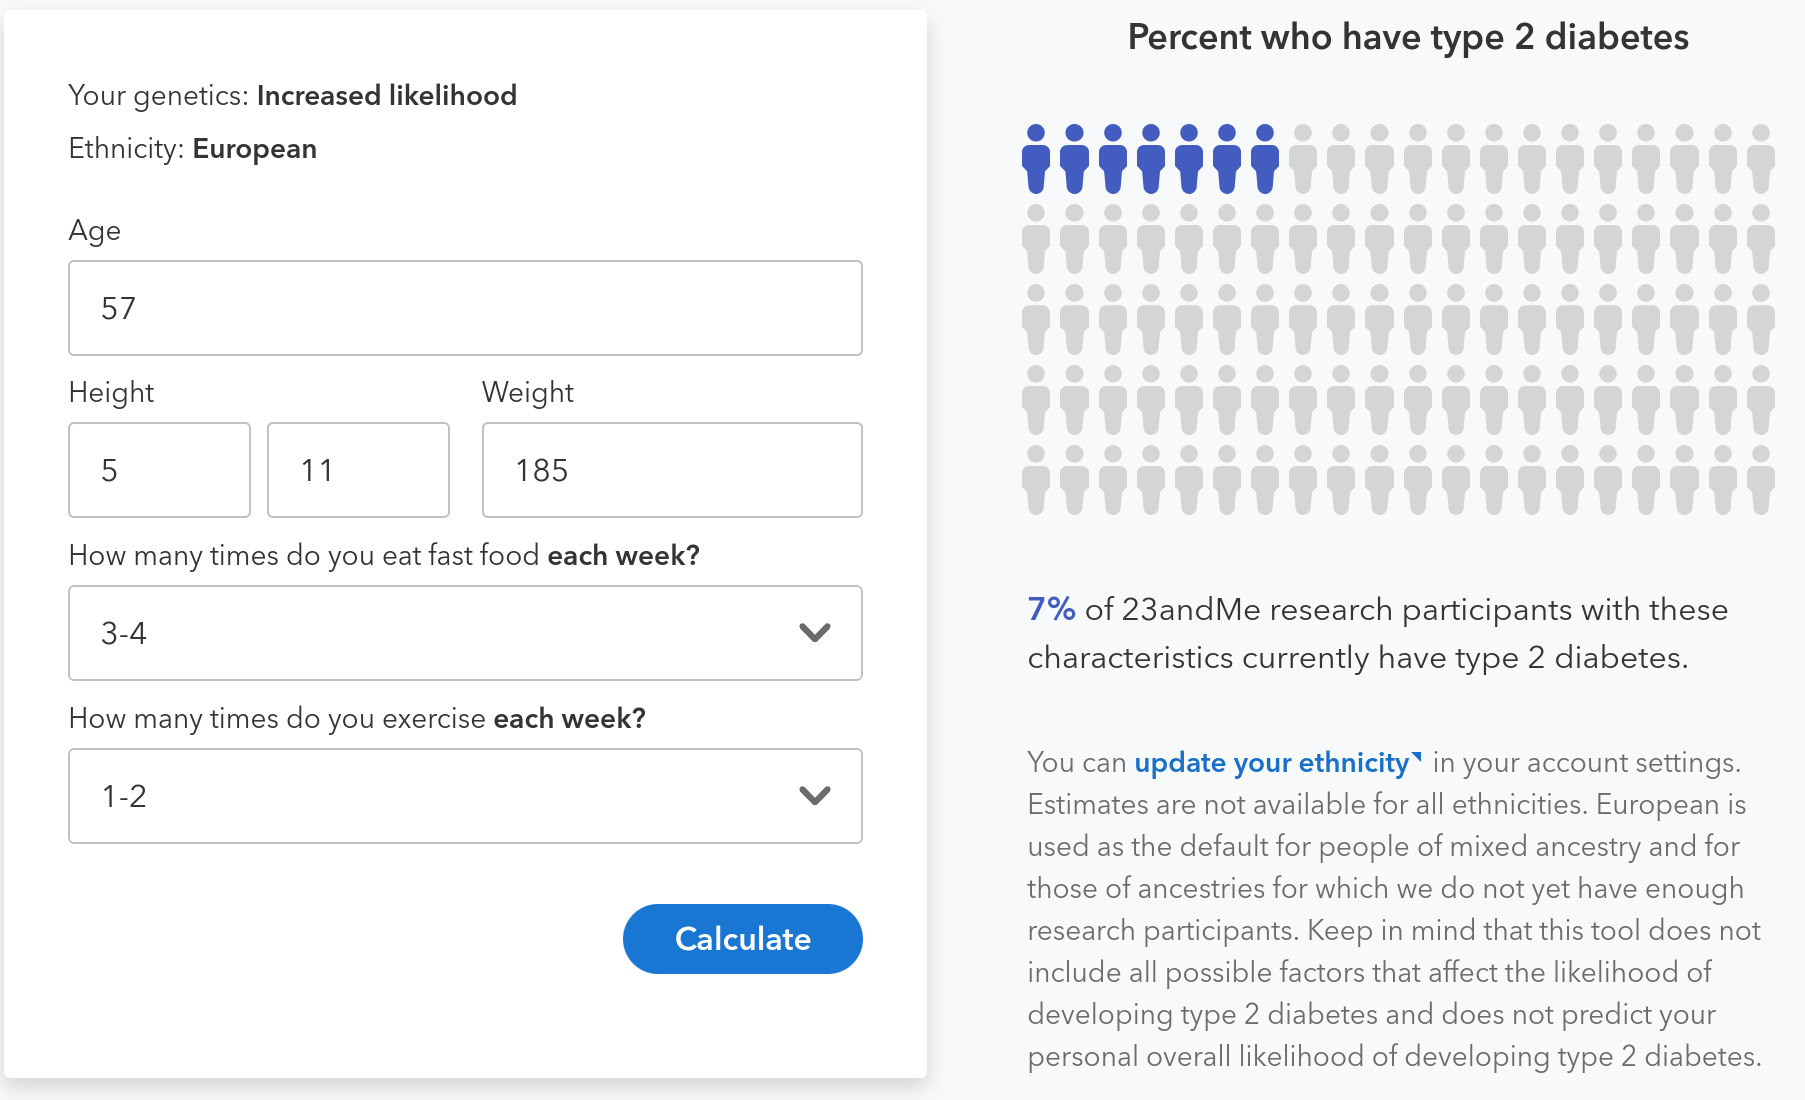
For example, even with unchanged weight, my risk of Type 2 diabetes more than doubles if I exercise less and eat more fast food. See two scenarios below — the first is my current “clean living” mode, the second is, unfortunately, easily achievable.
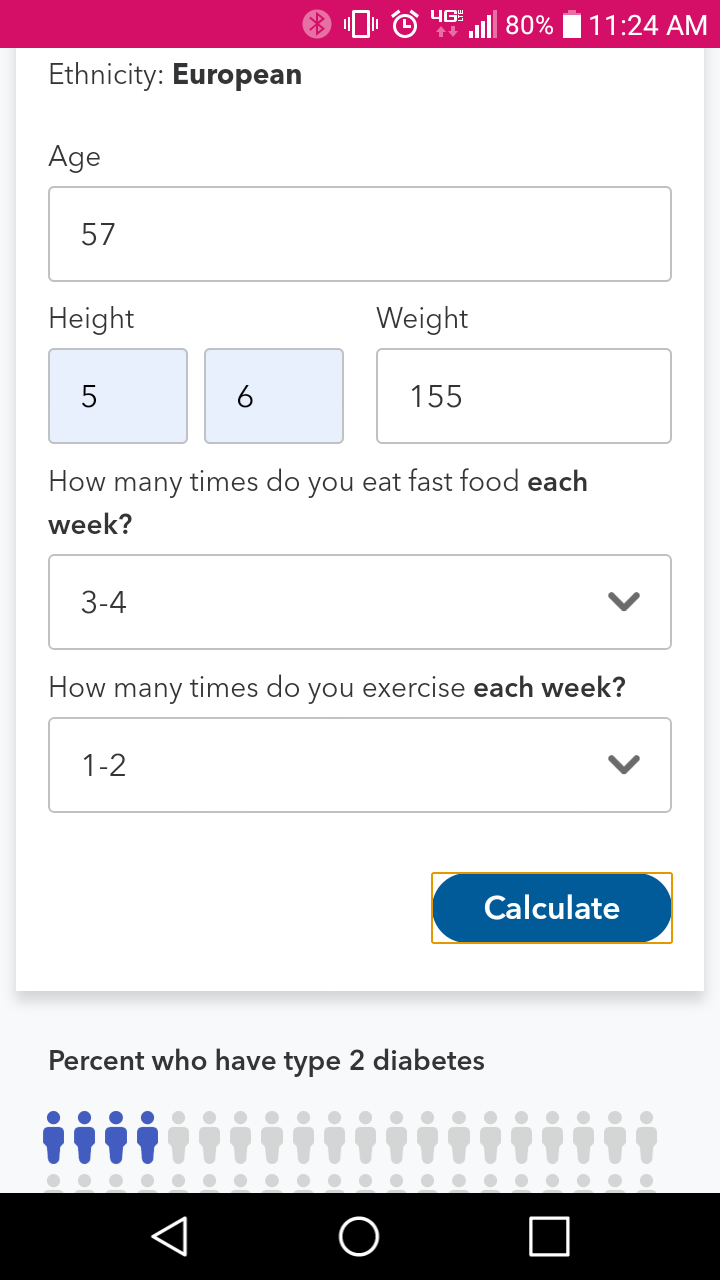
And below the graphics for my results, a quick look at a friend’s risk profile, which is very different under both scenarios.
A friend shared her profile, adjusted to mirror my age and relative weight.
At my age, her risk of type 2 diabetes will be 33% lower under the frequent-exercise-and-no-fast food scenario and 43% lower in the some-fastfood-and-low-exercise scenario than mine. Here’s her risk prediction for that scenario. Pretty amazing to see the differences in our metabolisms so exactly quantified.
[Caveat: Given the uncertain future of health insurance regulations, I might not have “officially” done a gene test if I were ten years further away from Medicare.]
As I’ve monkeyed with genetic tests, friends have reminded me that patients generally know a lot less than their doctors. (Yes, an eyebrow sometimes has been arched in my direction.) Overwhelmed by complexity and without years of rigorous training, patients are prone to grabbing at simple-sounding fixes. Avoid vaccines! Stop eating gluten! Gimme some Adderall! When seeking information, consumers increasingly rely on homophily rather than expertise — a simple article from Goop, Gwyneth Paltrow’s lifestyle website, may trump a nuanced article in the New England Journal of Medicine.
Doctors are swamped with nervous inquiries from people who don’t know a base pair from a tuba duet. “Physicians often get angry or irritated when patients seek and retrieve [genetic] information on their own,” noted a memo to doctors prepared by the American College of Preventive Medicine.
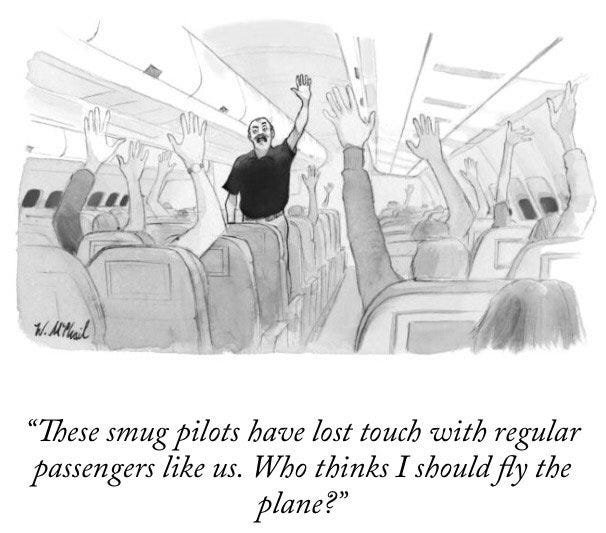
A New Yorker cartoon provides an allegorical snapshot of an archetypal 21st-century culture clash between highly trained experts (whether pilots, doctors, scientists or journalists) and their pushy, ignorant, know-it-all, Internet-empowered fellow citizens.
Yes, but… in fact, the cartoon’s premise is obsolete.
The idea that piloting a passenger jet requires years of training and practice — which are invisible to the bozo in seat 17C but which make the difference between getting to Pittsburgh seven minutes early and dying in a fiery crash — actually made a lot more sense 10 years ago.
In the near future, technological advances will make it conceivable for an untrained passenger to pilot a jumbo jet, gate to gate. (Trump’s claim that only an Einstein can fly today’s jets notwithstanding!) And if the price tag of a Boeing 787 Dreamliner were to drop 99.995% and if home garages got 50 times bigger, some intrepid untrained consumers might start piloting their own planes. They’d fly more often. They’d go places that commercial airlines currently don’t serve. And they’d fly in weather far more complex than even the best pilot might brave today.
Recently I spit into a little plastic tube and sent it off to 23andMe.
I sprang for the $200 DNA test because it was a fast, affordable way to detect genes relating to hereditary thrombophelia — a tendency to clot. I was interested because, in early October 2018, I had experienced a pulmonary embolism — in layman’ terms, clot(s) in a lung.
My primary care physician, a smart doctor a decade out of med school, had been “meh” on prescribing a genetic test. When we first talked, the week after I’d gone to the ER coughing up blood, he’d said my insurance probably wouldn’t cover the cost. Besides, the test results — positive or negative — wouldn’t be actionable. He also thought a consumer genetic testing service like 23andMe didn’t offer the specific test I wanted.
A few weeks passed. Tests for various cancers that sometimes trigger excess clotting — colon, prostate and lung — came back clean. My PE was categorized as “unprovoked,” which is medicine-speak for “no clue.” I was told I’d need to take prophylactic blood thinners for a long time, perhaps the rest of my life. (Some relevant stats: 1–2% of PE first-timers die. After the first PE, without blood-thinners, the five year odds of a reoccurence are 1 in 3. Mortality is higher for relapsers.)
So I started thinking about the gene test again. I was curious because identifying a guilty gene — hematologists look at the eFactor V Leiden variant in the F5 gene and the Prothrombin G20210A variant in the F2 gene — would provide both a smoking gun and a heads up for my kids.
I did some Googling. I learned that, since mid-2107, hereditary thrombophelia is one of nine “health predisposition” reports offered by 23andMe. (Ten, as of 2/27/19; eleven as of 3/10/19.) Since I’m less than a decade from Medicare and already have life insurance, I decided to take the plunge.
A few weeks later, 23andMe sent me an email with a link to my results — negative for clotting genes. No smoking gun. Cross that suspect off my list.
Since then, I’ve been trading emails with friends about various aspects of gene testing, particularly when done by consumers. Some of what was in those emails — thank you Tina, Brent, Corrine and Christian! — gets strung together below. I’m also indebted to Azeem Azar’s Exponential View newsletter, which I read almost every week.
Until 2013, 23andMe offered genetic reports on 254 diseases and conditions. But that November, after months of 23andMe ignoring repeated FDA requests for information, the agency stopped barking and bit. Declaring that 23andMe’s reports amounted to “medical devices” that required “premarket approval or de novo classification,” the FDA barred the company from offering any genetic reports relating to health.
Now, after years of 23andme’s concerted obeisance to the FDA, the company is allowed to offer eleven “health predisposition” reports, plus an additional 44 “carrier status” reports.
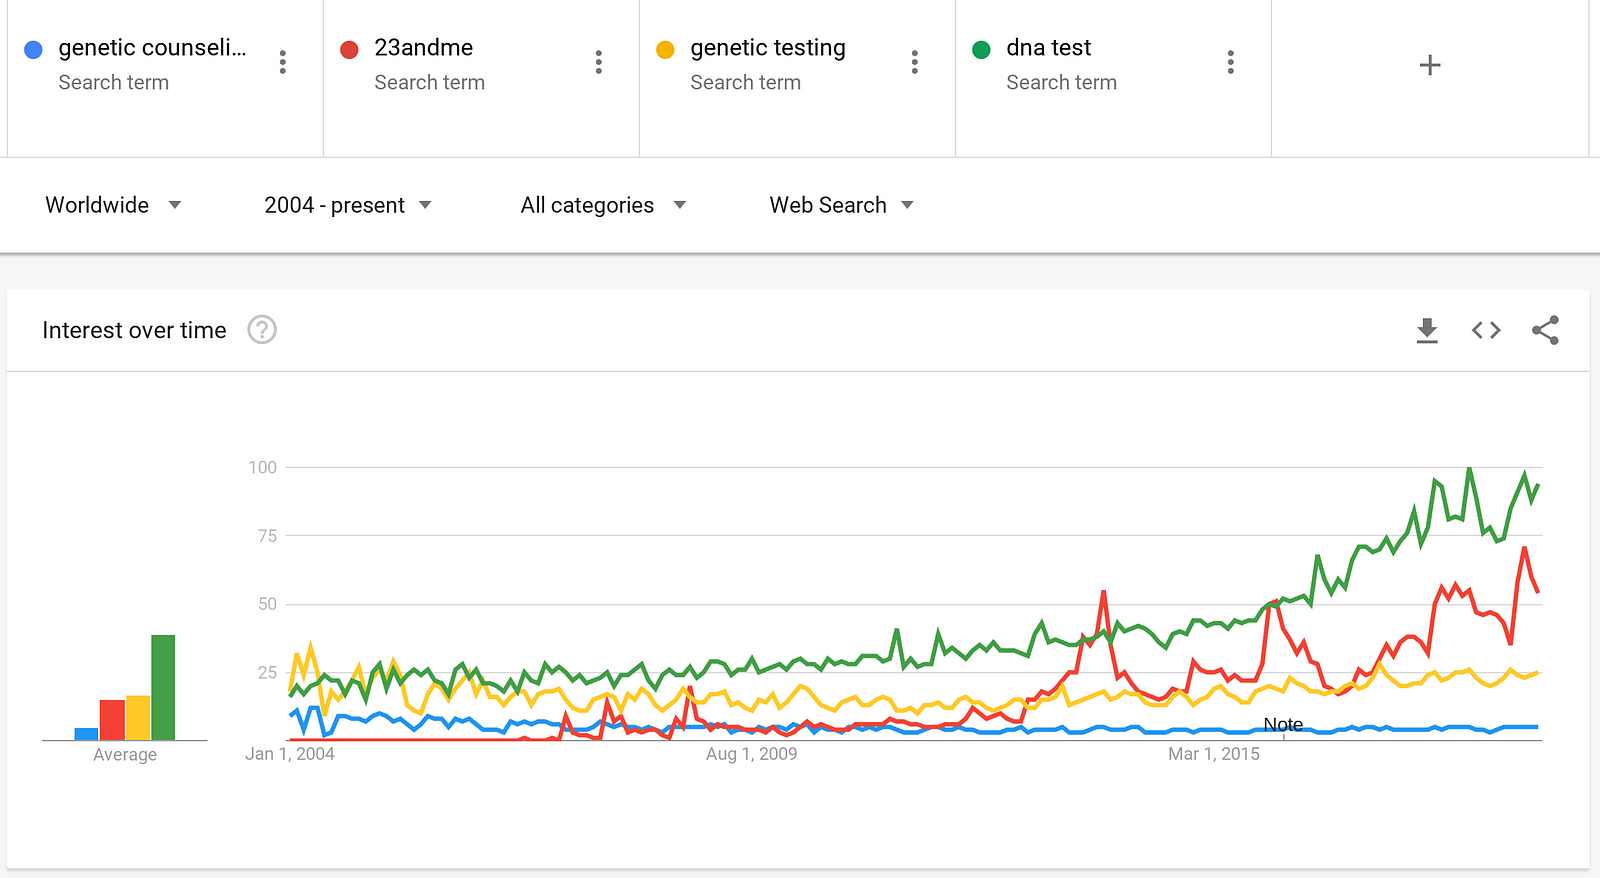
Despite the FDA’s bar on 23andMe’s provision of health results, consumer demand for genetic testing just kept rising. Searches relating to DNA testing now far exceed searches for conventional genetic counselling. If you’re curious about your DNA, Google is the new waiting room.
And while doctors, journalists and regulators obsess about 23andMe, 10 seconds of Googling summons numerous alternative services that offer genetic data relating to thousands of health conditions (from diabetes to schizophrenia) and drug responses (from lithium to insulin.) Many of these services, run by scientists building on NIH databases and open source software, are free or low cost.
My friends have asked about my DNA testing, so I’ve written a brief tour, both off-piste and official, of my results.
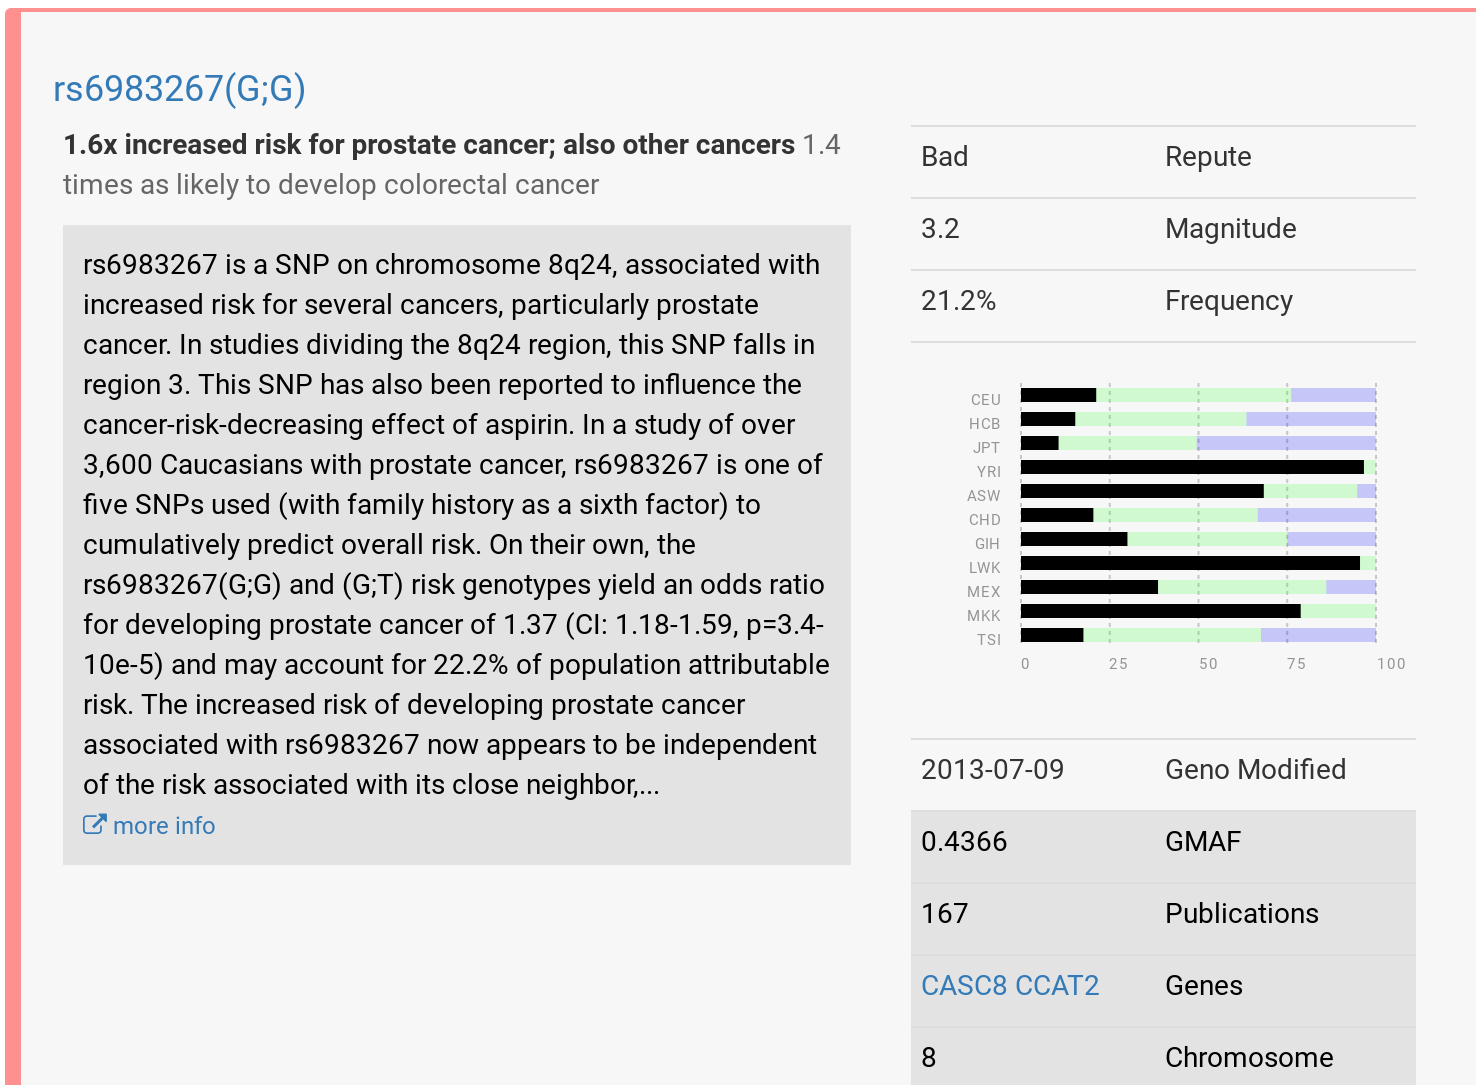
So far I’ve tried promethease.com and impute.me after uploading a file I exported from 23andMe. The reports I got back, with each SNP or cluster of SNPs linked to peer reviewed research, are incredibly rich. (SNPs are “single nucleotide polymorphisms,” the smallest unit of genetic testing.)
My Promethease results for SNP rs6983267 look interesting, but since I recently had a prostate test, they’re not actionable…
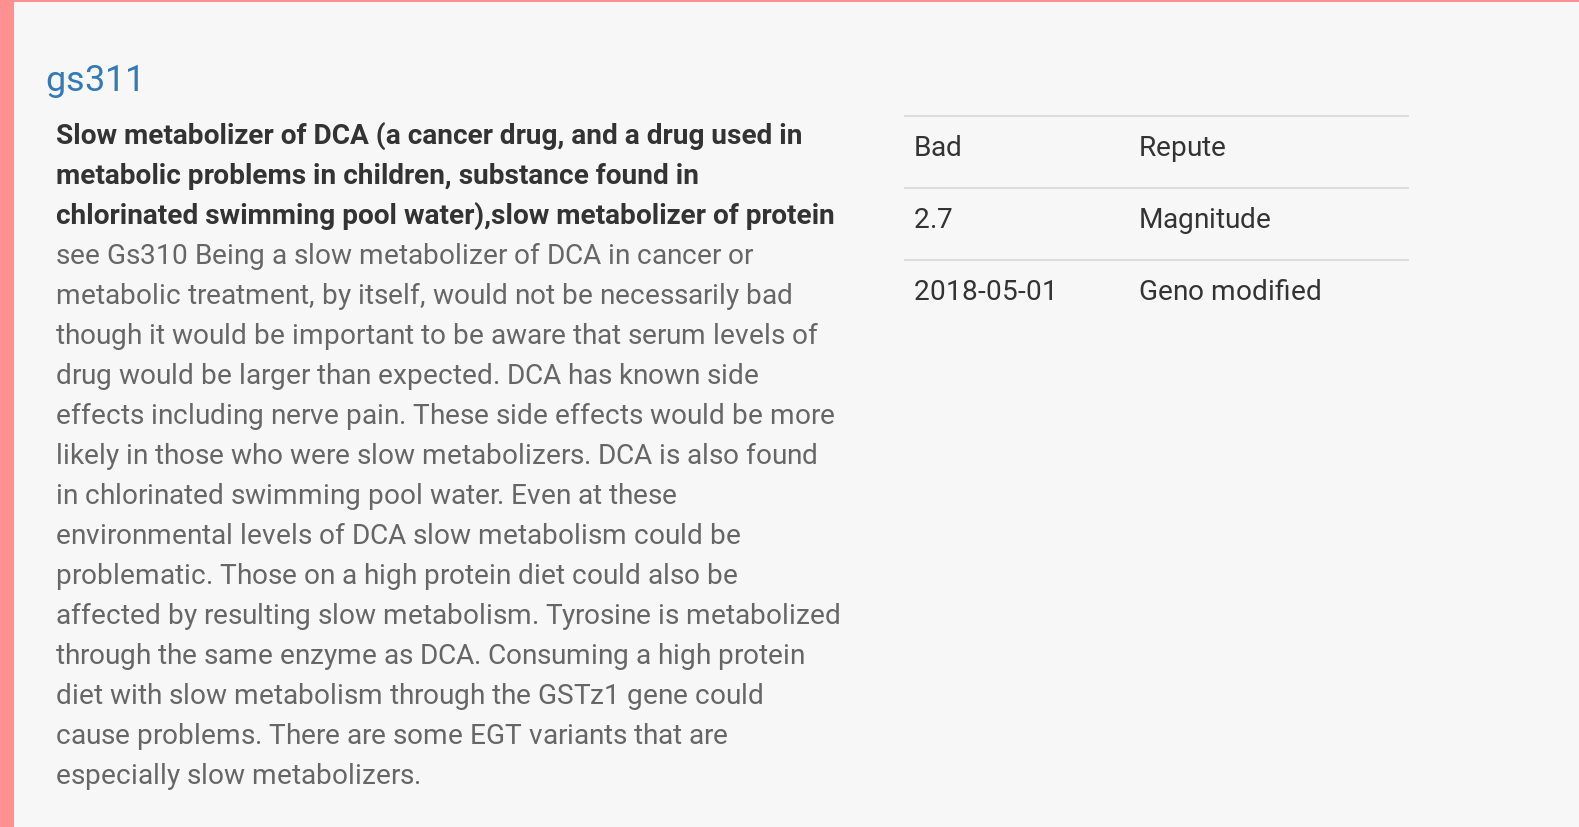
On the other hand, my Promethease results for gs311 might be useful if I had cancer and was due to be treated with DCA. (Or if I was tempted to eat a cheeseburger while swimming at a public pool.)
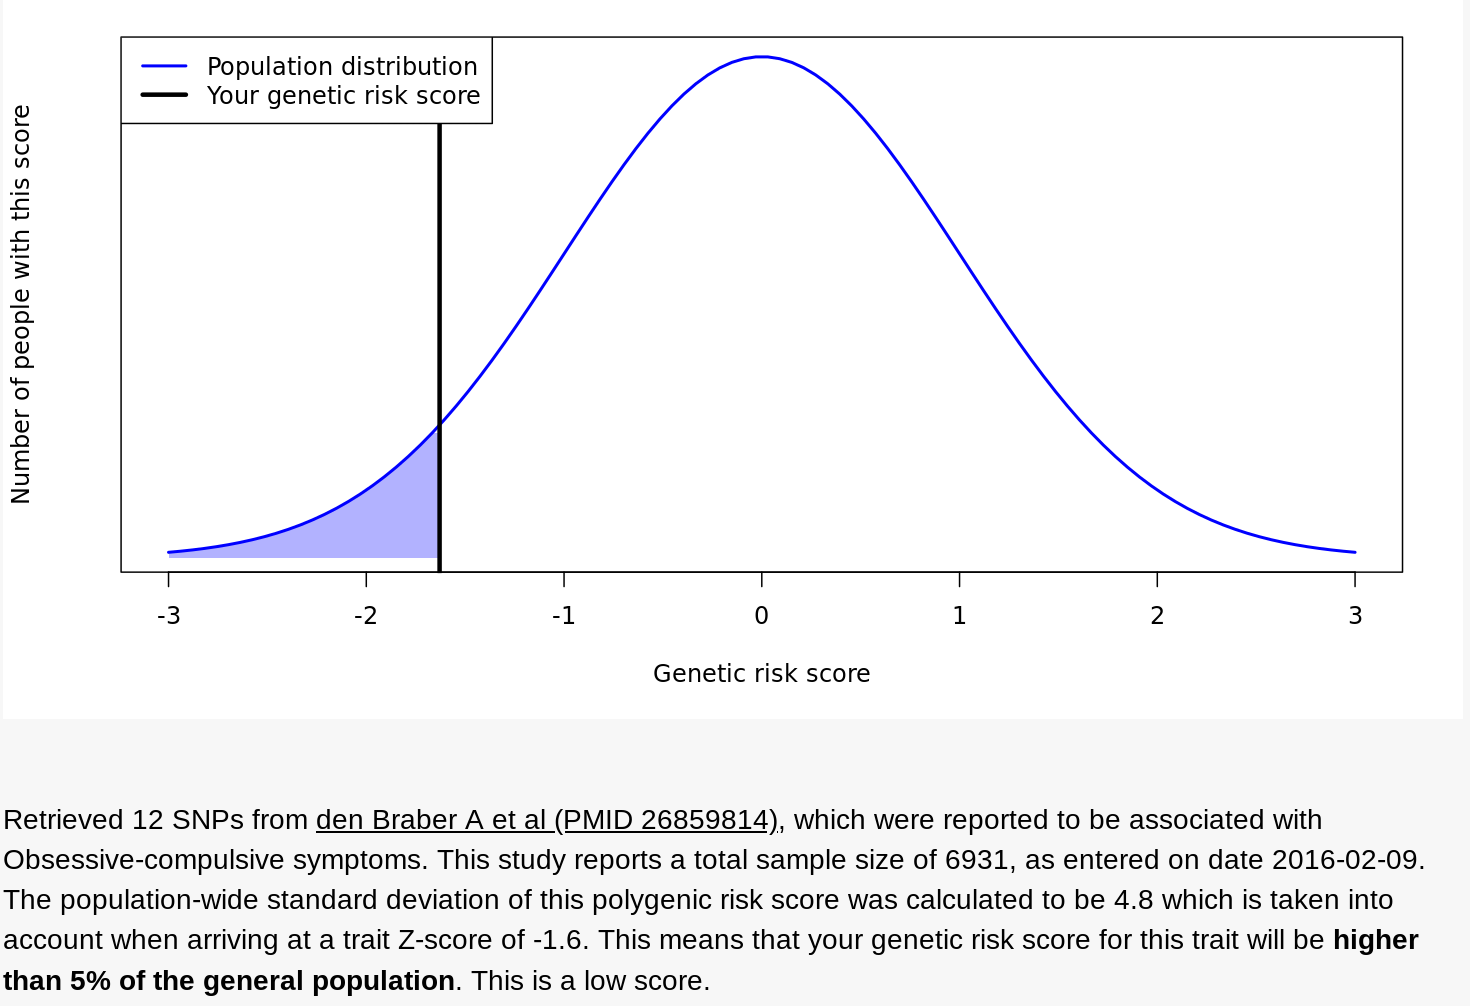
Impute.me offered another view — a holistic analysis of clusters of SNPs that various pieces of research associate with what the site calls “complex diseases.” For example, here’s my data for a group of SNPs that, at least according to one 2016 study of 6,931 people, correlates with a diagnosis of obsessive compulsive disorder. Seems I’m less genetically predisposed to OCD than most.
Finally, something relevant, at least for my dating life: I have the AG genotype for Rs53576, a section of the oxytocin receptor (OXTR) gene. Recent research correlates the AG genotype with being less empathetic (leading to a 4% reduction in marital satisfaction!) at least in comparison to the GG type. The good news, one study showed that social support lowers AG’s cortisol in stressful situations, at least relative to AAs; another study showed that AGs being more sympathetic to racial outgroups than GGs or AAs. (In the US, 41% are GG; in Africa, 65%; in East Asia, 12%, according to Selfdecode.com.)
23andme emailed a few days ago, subject line “Your new Type 2 Diabetes report.” I clicked and learned that my “genetics are associated with an increased likelihood of developing type 2 diabetes.” My odds were 30% in the next 30 years, “higher than typical,” according to 23andme. But I already knew that from both Promethease and Impute.me.
What’s news is that 23andme has, based on lifestyle surveys of its customers, quantified how weight, exercise and fast food consumption interact with my genes. 23andme reports that, using data from 2.3 million customers, it discerned 1,000 genetic variants that could be used in assessing individual risk scores. (Here’s 23andme’s whitepaper on the work.)
Playing with 23andme’s predictive widget, I’ve learned that losing 15 pounds could cut my risk of type 2 diabetes from 3% to 2%. Conversely, raising my weight by 15 pounds would boost my risk to 4%.
Switching from my current regimen (let’s call it “max health” — zero fast food and exercise seven times a week) to a weekly regimen that’s “typical” — eating fast food 3–4 times, exercising 1–2 times — more than doubles my risk of type 2 diabetes, even if my weight doesn’t change.
Comparing results with a friend, I’ve confirmed that risks are very different for people with different genetic profiles. She currently has just a 1% chance of diabetes. That’s not just because she’s in her 30s and lighter than her peers. Adjusting her model to match my age and weight-relative-to-peers, her risk of type 2 diabetes is 33% lower than mine under “max health” scenario and 43% lower in the “typical” scenario. Pretty amazing to see the differences in our metabolisms so exactly quantified!
The classic rap on gene tests has been that they don’t yield actionable information. I’d say those days are over. I’ve now learned that I require more exercise and less fast food, relative to my peers, to reduce my already high odds of type 2 diabetes. Visiting Wendy’s once or twice a week is a LOT less tempting after the latest 23andme report.
I obviously survived the morning run on October 6, though I walked most of the second half of my four mile “run.”
After lunch, I talked with my kids about what I described as my “odd health development.” They suggested I go immediately to the emergency room. I shared my analysis of the cons of a too-hasty visit to the ER, without worrying them with my cancer self-diagnosis. Knowing that I’m ornery and contrary, they kept hinting and nudging, but didn’t try shoving me out the door or calling 911.
I coughed up blood a few more times as the day passed. Harboring my own grim self-diagnosis of cancer, I dismissed my kids’ Google-based (and in retrospect accurate) attempts at diagnosis. I made it through the daylight hours. Though I wasn’t thinking about this consciously, I regularly stood and paced, or jiggled my posture to dull the jabs.
But when I finally tried to lie down in bed at roughly 11.30pm, the jabs were sharp and unavoidable. Cancer or not, I realized that the only way I was going to sleep was by getting to the hospital. I drove 10 minutes to the UNC emergency room.
There, I got a tiny dose of good news. Having spent the day dreading getting stuck in the ER waiting room among slumped Vladimirs and coughing Estragons, I discovered that I was a heath care VIP. It turns out ER staff roll out the red carpet if you’re a middle-aged guy who shows up at midnight complaining of chest pains and coughing up globs of blood. You’re invited to step around the velvet ropes, past the sick masses. In minutes I had my own private booth, with a white-coated maitre d’ ordering for me off a menu of gourmet analytical delights — D-dimer and Troponin tests, CAT scans and more.
By 2am, my diagnosis was back: blood clots in my right lung, known to medicine as a pulmonary embolism, or PE. Though my PE appeared to be atypical or “unprovoked” — no surgeries, long flights, pregnancy, and I’m breathing fine (I think) with normal heart rate — the radiologists had seen several. Various blood tests corroborated the diagnosis.
I asked why I was hawking up blood. The doctor said when my pulsing blood hit the clots, there was enough back pressure to push blood out into the airways, where it gradually pooled until my lungs saw fit to hawk it up. And the jabbings were infarctions, basically tiny shrieks of lung tissue dying when it wasn’t get enough oxygen.
Yikes. Had I risked a stroke by not rushing to the hospital immediately?
No, said the doctor. I was relieved. He added, “PEs go to your heart. Heart attack.”
So my morning run was a bad idea? “Yes,” after microsecond of diplomatic pause (or incredulity?)
I was told to start taking a blood thinner immediately. “Xarelto. You’ve probably seen ads for it on TV.” Over the course of hours, days and weeks — no timeline can be guaranteed — my body would dissolve the clots and I’ll start feeling better. The risk of a heart attack goes down significantly — almost to zero — over the next 36 hours.
Death #1 averted.
I was told that there was nothing more to do that night. Though I stayed in my gurney, my heart rate and blood pressure leads were disconnected. After some paperwork, it would be time to go home.
Ever the skeptic and second-guesser, I had niggling doubts about this diagnosis. The nurse reiterated that the clots were in my right lung. I noted that the pain was all in my left rib cage, never in the right. I said I was still in significant pain and I don’t want to be discharged. She explained that internal pain is often displaced, since there’s no evolutionary reason for internal-organ-specific pain signals.
The nurse suggested a small injection of morphine. “This will take the edge off. When it wears off in 45 minutes, you can decide.” The end of the sentence — “to go home” — was unspoken, but strongly implied.
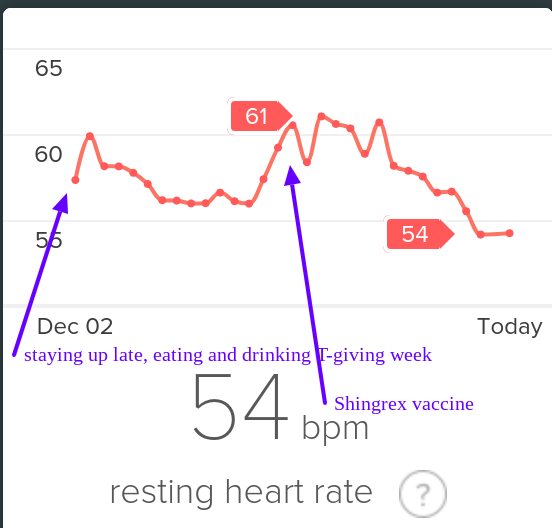
I bought a Fitbit Charge 2 in early 2017. In the Racery blog, I praised Fitbit’s insights into my heart rate, heart-rate variability and sleep stages. Fitbit revealed intriguing patterns. For example, I learned that (at least for me) staying up late eating and drinking beer elevates my resting heart rate for a few days — exactly as much as getting a cold or vaccination.
Fitbit resting heart rate December 2018
I even bought a sliver of Fitbit stock, figuring that even if the company fails to thrive, it has a high probability of being acquired for its hardware, patents, user base… and data. Fitbit’s ~$1.2 billion valuation seems like a drop in the bucket relative to the half trillion bankroll held by the likes of Google, Microsoft, Apple, and Amazon. Eventually, I upgraded to a Fitbit Ionic, which had enhanced heart rate monitoring.
At the same time, I became frustrated by what I could not do with my Fitbit data. When I tried to export the data, I learned that I would only access data per day or per run, and only in one month batches. (In November, 2018 this finally changed.)
To find patterns in the connections between my running, heart rate, and sleep, I wanted to export Fitbit’s raw intraday data to services like Smashrun, whose software creates marvelous graphs. Does my heart rate match my step count sometimes in the final miles of a long run, allowing me to accelerate by 1 minute per mile? How many total heart beats do I tally on a long run… or in a day or week or month? Unfortunately, Fitbit’s graphs are static and clunky, with the granularity of a color TV from 1971. In contrast Smashrun’s graphs are like a steadycam displayed on a 65″ 4G. Fitbit’s graphs are five minute aggregates; Smashrun’s are by-the-second.
Compare Fitbit’s static graph of resting heart rate (above) with the following animation of one of Smashrun’s interactive, multi-layered graphs.
Smashrun’s interactive graphs are killer! (Source.)
I was frustrated to know that my granular intraday FitBit data WAS apparently accessible via companies like data aggregator Validic. But Validic’s customers are all businesses (insurance companies, drug companies) and it charges a minimum $10k year to deliver data for 2,000 people.
Strava, tightly focused on training needs of the athletic 1%, allows users to compare runs, but makes it hard to overview those runs.
Why, I wondered, couldn’t I easily access this data myself or pay a third party service like Smashrun to provide analytics?
I emailed Chris Lukic, Smashrun’s founder, with this question. He says he regularly encounters a variety of obstacles in integrating data from tracking devices and apps. He listed some of ways companies make data export harder than it needs to be:
Create an API to allow access to the data, but restrict its use to “selected partners”. Then require those partners to make huge concessions — Garmin has a $5k fee, Strava reserves the option to request the data be deleted after transfer and to add their branding, Nike used to require you to give up equity in your company to use their API (through a partnership with Techstars)
Allow data to be exported but make it inconvenient. Clicking on lots of links to export individual files. Companies very rarely allow “their” (your) data to be pushed to other systems.
Fail to QA or bug fix data export formats. TCX and GPX files are the most common for running and heart rate. These formats are notorious for loose standards. Things like pauses, laps, descriptions, cadence, and heart rate data are defined differently by different apps. If the file imports “incorrectly” users almost always consider it the fault of the importing system rather than the exporting one. Runkeeper, for example went for years where there app would create exports with a UTC timestamp (which is correct), but their website exported files with a local time stamp. To get the time of an activity correct you needed to look for clues as to whether it was created by the app or the website, and then handle it appropriately.
Provide only limited detail in exported formats. This might mean only exporting some fields (speed but not heart rate for example) or more commonly just reducing the dataset entirely. Runtastic for example might export only one out of every 10 data points recorded. Only enough to draw a map, but not evaluate the pace.”
Four stipulations:
Stipulation #1: I should have gone to the ER immediately after I coughed up blood. Not doing so was stupid and 100% on me. In light of the sudden appearance of blood, my assumption that my situation was non-acute (because of the months of accumulating tiredness and rib needling) was absurd.
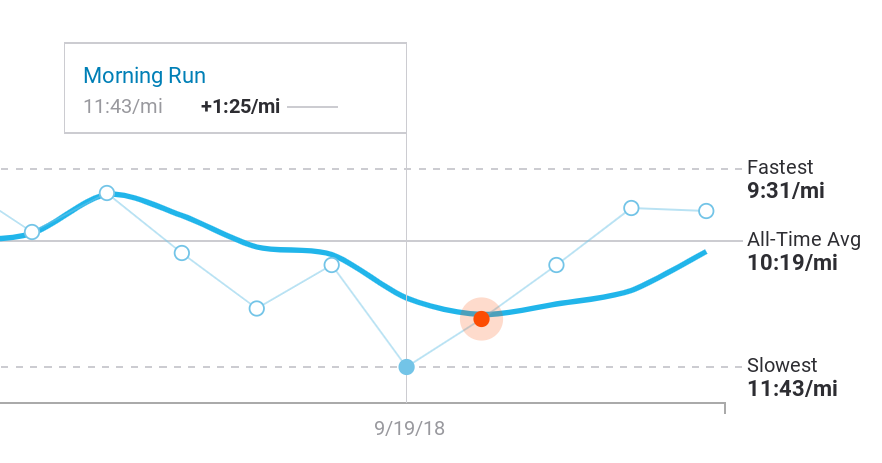
Stipulation #2: While I might have gone to the doctor months earlier and complained that I was “slowing down,” an email from Fitbit (or some third party service I might have hired to flag health developments) somewhere along the way saying “though your daily step counts indicate that you remain active, your pace during runs has slowed 20% in the last six months” would have been immensely helpful in jarring me out of my complacency, or denial. An enclosed chart would have, to boot, given me something to show a doctor.
Stipulation #3: Fitbit never promised to save my life. The company peddles fitness gadgets bundled with software for graphing and competition. (It does make occasional and very generic health recommendations: “walk another 75 steps to reach the healthy hourly goal of 250 steps!”) Fitbit’s site urges customers to “know yourself to improve yourself,” not to “track your heart rate to predict a cadiopulmonary disaster.”
Stipulation #4: I’m a middle-of-the-pack runner, doing 1–3 miles almost every weekday and trying to do 10–15 miles each weekend, if I can carve out the time. I run 3 or 4 races each year on trails rather than roads, and usually ignore my mile times. Aiming only to finish in the middle of the pack, I lack any consistent record of how fast I run miles. A diligent note taker — many runners are but not me — would have probably quantified the severity of my slowdown and taken action.
But I didn’t. And when I go back to look for evidence of my deceleration, the data that’s readily available in Fitbit is either far too detailed or way too zoomed out.
For example, when I look at per month totals, Fitbit offers blocky graphs relating to my food, sleep and weight, but that’s data I don’t care about about or, with the exception of sleep, could easily track myself in a notebook.
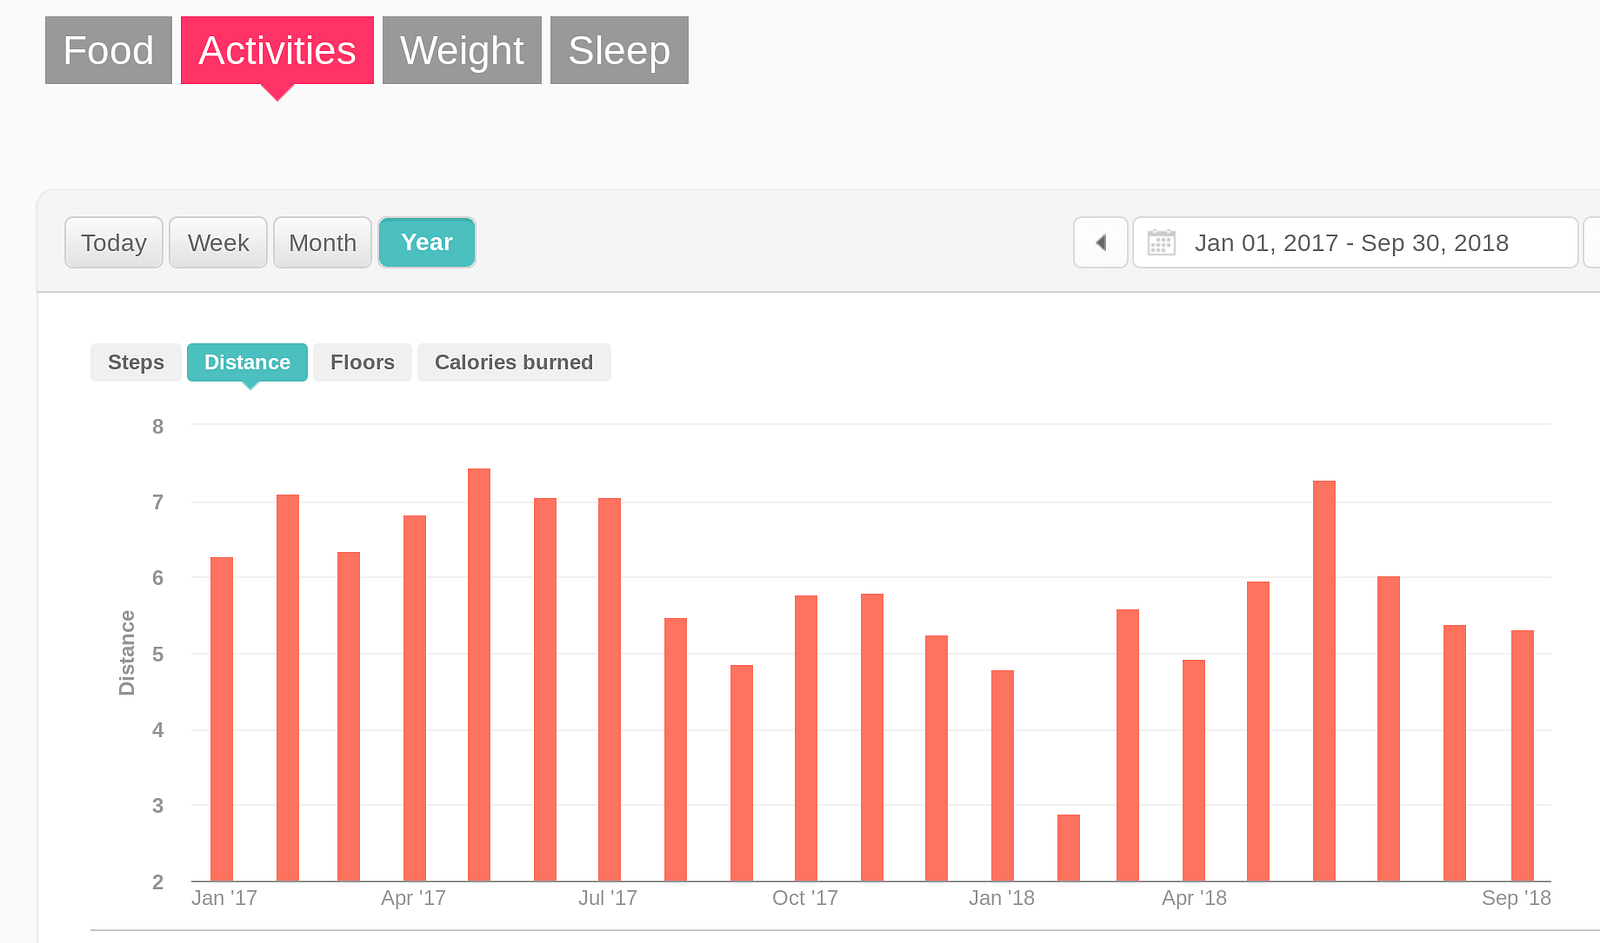
I’ve located some “big picture” graphs about my exercise, but they’re also not helpful. Consider, for example, the trendlessness of Fitbit’s graph (below) of the average number of miles I cover every day. Note that this is NOT the amount I’m running… its just the amount I’m moving. So, because I was increasingly substituting walking for running, the graph hides my downward health trajectory. Secondly, there’s no way to graph heart rate over that period — how many minutes per day was my heart rate elevated? What was my average heart-rate on runs? How often did I slow to a walk on long runs? Not possible.
2017–2018 daily distance averages leading up to October 6, 2018. (February’s drop reflects my taking time away from running after a stress fracture in my left foot. I substituted pool swimming for running.
As noted above, as 2018 progressed I’d sensed that I’d been slowing, but I never zoomed out to look for a pattern and, in Fitbit’s software, it’s not clear the pattern would have been visible no matter how I sliced the available data. It might have been easy to conclude that I was still recovering from a stress fracture in February that knocked me off trails and into the swimming pool for a month.
So that’s a Fitbit fail.
Casting about for other foreshadowings in the data, I go back and dig through various graphs in Strava, a racing app for cyclists and runners that imports data from Fitbit and other wearables. In Strava, I can only compare runs on specific routes. But at least in Strava I can see the actual slope of my declining health — nearly 20% from the previous April to two weeks before I started coughing up blood.
That particular slice of data is not available in Fitbit’s graphing toolkit, and is only buildable in Strava with a lot of digging and prodding.
Again, my blindness (or denial) about my own declining cardiovascular health and its potentially devastating implications for my longevity are entirely on me. I’m writing here to note that the fitness device industry, and Fitbit in particular, is missing an opportunity to help prolong the lives of idiots like me. And maybe make some money along the way.
My difficulty accessing and analyzing my own fitness data is grain of sand in a Sahara of systemic failures, shortfalls and dysfunctions in how health data is generated, stored, shared and processed. Those dysfunctions include:
Health data is fragmented and sequestered among a long list of providers, systems, devices, institutions, organizations.
Health data fragmentation, oh my, oh my.
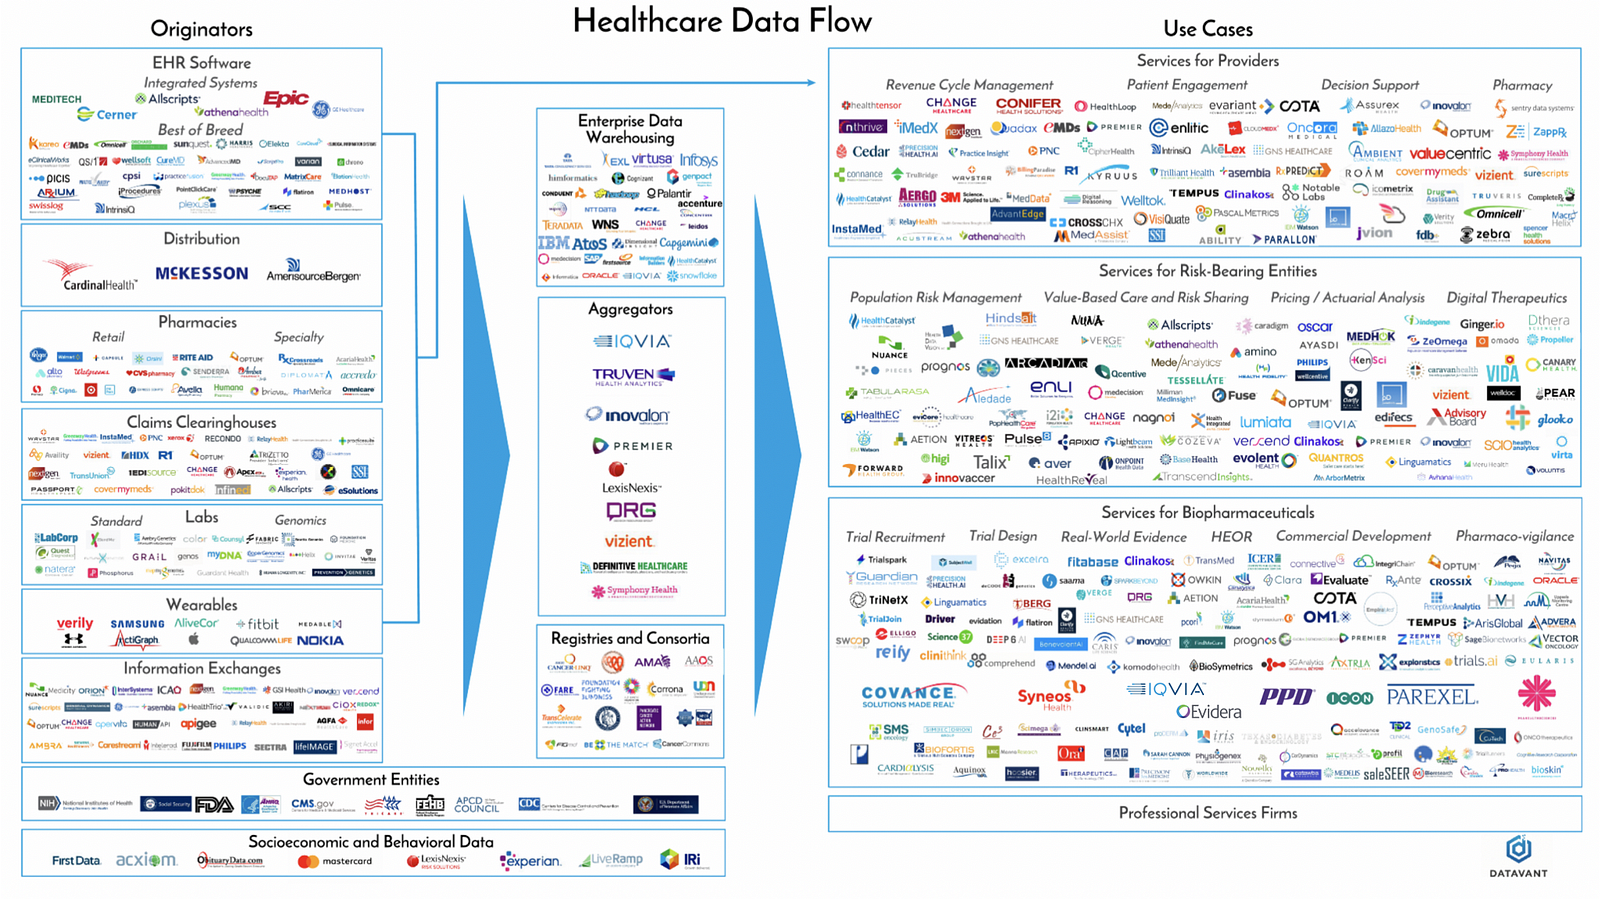
2. Not only are the number of producers and processors of data growing yearly, volume is exploding too. According to Datavant, “The healthcare system generates approximately a zettabyte (a trillion gigabytes) of data annually, and this amount is doubling every two years.”
3. Even as technology’s capacities — storage, processor speed, algorithmic efficiency and subtlety — expands 100-fold each decade, it is still steered by humans — fragile tissues of self-serving biases and beliefs embedded in institutions that are, above all, bent on survival and self-celebration. What does this mean practically? Though medicine today aspires, more than any other industry, to promote human health, it still takes decades for doctors and med schools to move on from disproven treatments and devices. It took 150 years for physicians to accept that thermometer was superior to human touch, and change remains “generational,” according to Dr. David L. Brown, a professor in the cardiovascular division of the Washington University School of Medicine in St. Louis. Doctors remain exceedingly loyal to the techniques and technology they rode in on, particularly when the practices help pay bills. (Brown is co-author of a meta analysis that examined all current studies of stint implantations in treatment of stable coronary artery disease. Though stints provide zero benefit to patients who are not suffering a heart attack, hundreds of thousands of stints are implanted, each with a 1 in 50 risk of serious complications.)
4. As each organization competes to extract its own smidgen of insight, profit or leverage from the data it creates or touches, it mangles the data slightly, whether inadvertently or intentionally, to fit its own needs with omissions, concatenations, mergers, nonstandard labeling, units or time series. This goes from individual studies, in which goalposts are regularly moved (an example) or data is “lost,” to larger analyses, in which inconvenient data is systematically elided, to medical journals themselves, which former editor of the New England Journal of Medicine Marcia Angel argues have been manipulated to the point of shilldom by the drug industry.
5. Then there’s the FDA, the agency that regulates US medicine and devices. On the one hand, the FDA is the consumer’s best defense against huckers peddling sham science — sugar pills or worse sold to desparate patients and credulous doctors (or impatient patients and quacks.) On the other hand, some argue the FDA raises the cost of innovation and kills potentially life-saving drugs. Regardless, the billion-dollar-plus cost of developing new drugs and regulatory barbed wire inherently favor existing, highly capitalized drug companies over upstart developers of cheap, common sense solutions.
The FDA, which originated in the late 19th century as the “Bureau of Chemistry,” has evolved as a creature within a complex interlocking ecosystem made up of PHARMA, researchers, med schools, doctors, legislators and lobbiests. Most of its staff have worked in multiple roles across the ecosystem — they’re imprinted with the same DNA, an atomic paradigm of health.
At roughly 3am, the nurse comes into my little cubicle to ask how I’m feeling post morphine injection.
She notes, once again, that I’m cleared to go home. The forms are ready. Nudge, nudge. Ready?
(In retrospect, I was now — in the staff’s collective medical wisdom and probably explicitly declared to be so in the charts — a “solved” case who was clogging up an emergency room bed that could be given over to someone in the waiting room. ERs are paid to “turn” beds.)
I tell the nurse that I’m still in significant pain. In fact, I’m feeling kind of clammy.
Woozy even. The pain is increasing? In fact. Excuse me, nurse. I need a bucket. I’m feeling nauseous.
My sense of pain and general unease gathers into a feeling that something’s happening that I don’t understand.
You’re very pale, says the nurse.
She reconnects my heart monitor leads. My heart rate is 55 beats per minute.
And then it’s 50.
Then 45.
Suddenly my little bay starts to fill with the cast of nurses, orderlies and the junior and senior doctors I’d seen on stage at various times earlier in the evening. Maybe ten of them in all… why?
40.
You’re white. How are you feeling?
Kinda woozy. Crappy, actually.
35.
My HR seems to be dropping 5 bpm each quarter minute. Sweat is dripping off my face and neck, pooling where my chest meets my stomach. I’m wishing I could see my kids. To say goodbye?
30.
I muse: if this is death, where are the lights and tunnels and trumpets?
Someone is placing two palm-sized, wired, adhesive pads on my upper chest. Shock paddles.
Standing at the foot of my gurney, the senior doctor tells me to keep updating him on what I’m feeling.
Well, my eyesight is getting fuzzy.
And now I can’t see you.
25.
So that’s the second time FitBit was mute when it might have helped keep me alive, or at least warned me and my doctors that I shouldn’t drive home.
Could Fitbit, or some service accessing my data with my permission, have sent out a distress signal before my heart-rate started dropping 5 BPM every 10 seconds? Recent research suggests that panic attacks, long thought to be spontaneous responses to external cues, may be foreshadowed in autonomic data by as much as three-quarters of an hour. But it will be a LONG time before any tools are available for my problem, or those of panic attacks.
That’s stupendous, but it’s also trivial compared to the potential research that could be done. FitBit’s terms of use state that Fitbit owns all “Fitbit Content,” which includes any “data” “generated” with its software. I own my heartbeat, Fitbit owns my 0s and 1s. And Fitbit squats on the motherload of health data — all the data from all the Fitbits.
Fitbit’s nonchalantly selfish stewardship of our (my!) immensely valuable data is on prominent display when company staff boast about Fitbit’s scientific value. “We’re in this unique position of having access six billion nights of sleep data, and this is an area we haven’t done much yet,” Fitbit’s director of data science, Hulya Emir-Farinus told gadget guru David Pogue in an August, 2018 interview.
Fitbit gave Pogue an “exclusive deep dive” into 150 billion hours of heart rate data, which contained fascinating insights. For example, Fitbit’s data shows that an inactive 45-year-old man can drop his resting heart rate (RHR) by 5.5 beats by doing 40 minutes of exercise daily. But a 75-year-old who excercises 40 minutes a day has a RHR that’s less than 2 beats per minute lower than his innactive buddy’s. (Why does this matter? A lower RHR correlates strongly with lower risk of dying.)
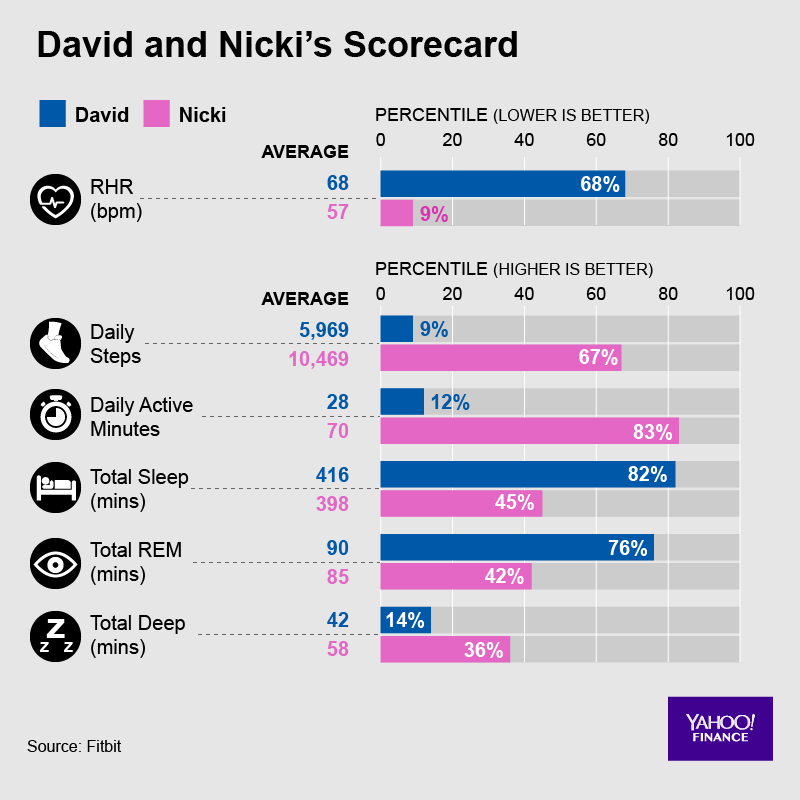
Wouldn’t you love quantification of the relationship between your own daily exercise minutes and your resting heart rate? If your rate is higher or lower than average person, that might suggest something about your overall health or longevity. Sensing the value of this relative information, Fitbit gave Pogue details about where he and his wife sit in the bell curve of Americans for HR, sleep and steps. (Below.)
But the rest of us, who contributed the data, will have to wait to take our own look at the data.
Fitbit gave Yahoo’s Pogue details about where he and his wife sit in the bell curve of American for HR, sleep and steps, context it doesn’t explicitly provide other Fitbit owners.
I’m told that, at around 20 BPM the morning of October 7th, the senior doc told a nurse to inject atropine, which takes the brakes off your heart-rate. I remember (or imagine) a jab in my left shoulder. 1.5 milligrams? (I don’t see any record in the online health record UNC provides.)
When I was again alert — was it 15 seconds or two minutes? — my gurney was in central work space, which I was told gave the staff more room and equipment for emergency procedures… if those became necessary… in another 20 heart beats or so? In any case, the shock paddles weren’t used, which friends now tell me could have been very painful.
The conclusion? “We’re not exactly sure what happened, but are pretty sure it’s not caused directly by the PE. In short, we think you were fainting.” No medical professional — friends who are nurses and doctors — I’ve talked to since has had a better explanation. My subsequent conclusion — you know I was a Boy Scout, right? — was that my body was rebelling against a combination of 36 hours of pain, sitting up in the bed with not enough blood going to my brain, my lung(s?) dealing with puddles of blood, the intensified misery of lying in the CAT scan, being cold, the morphine jab (or its ebb?). Who knows.
If it was “just” fainting, the heart rate collapse probably wouldn’t have killed me outright, but might have been disasterous had I’d been driving home at the moment it happened. In any case, the ER doctors reversed course on the discharge order, and decided to keep me in the hospital for observation.
I dozed in the ER bed until 10am waiting for space to clear up in the hospital’s observation unit. By midday, my rib jabbings were, as predicted, slightly fainter. The blood thinner was already working. Two weeks later, blood no longer gurgled in my throat when I coughed. I realized one morning in November that, at some point in recent days, I had stopped feeling the jabs, even during my biggest inhales. Tests for various cancers — apparently the smoking gun for 10% of unprovoked PEs — came back with no hints of cancers.
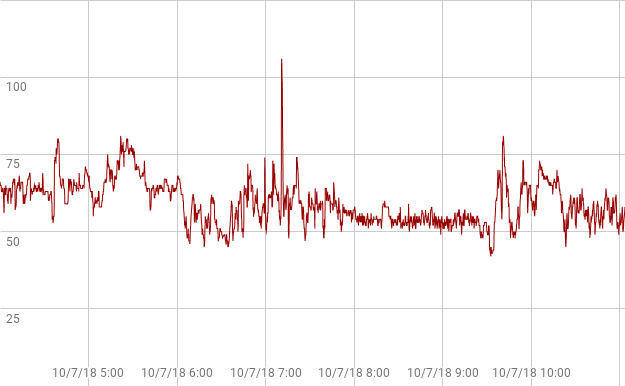
A a couple months later, after lots of clicking around on Fitbit.com and reading forums, I learn that Fitbit has expanded its data access from the prior one-month-only single-point-per-day data dumps. Though the new data access was not real-time, and many users are frurstrated by the new format, I can get the data I wanted. I downloaded a big file, downloaded a third party tool that converts file formats ($10/month), dumped the results of that conversion into a Google spreadsheet, dug some, figured out how Fitbit’s time-stamps convert to my local time, then used some graphing software. After 45 minutes of reading, digging and tinkering, I finally managed to dig produce a snapshot of the incident. Here’s what I saw.
You can see the steady decline leading into 9.30am UT, though the real cratering to 20, never registers in Fitbit. (Data from that period rates “low accuracy” in another measure Fitbit provides.)
Obviously Fitbit failed to capture the full collapse the hospital’s heart monitor had captured. My wrist was too sweat-drenched? Fitbit discarded the data because it appeared so abnormal? Was there a clue of what was to come — as with panic attacks — in the smooth decline of the prior 90 minutes leading to the accelerated slide? Until Fitbit asks the question of its millions of data points — or lets me ask the question of my own data — we’ll never know.
As 2019 progresses, I’m told I may be on blood thinners for the rest of my life, since going unmedicated gives risking a 30% chance of clots over a five year period. (Medicated, my odds of a PE are 1 in 60 per year.) I’m back to doing 30 minutes of 9.5 minute miles, and sometimes 6 miles with only a minute or two of walking on steep hills. And I’m still wearing my Fitbit Ionic, though the band is failing badly.
Tales from a six month journey on the borderlands of health data
Like most of my Saturdays, October 6, 2018 began with an extra-large coffee laced with plenty of cream. And a book, in this case Yuri Slezkine’s mammoth The House of Government.
Built in the 1920s across the river from the Kremlin, the House of Government was a luxury apartment complex for the Soviet elite. Directly in the sight line of an increasingly paranoid Stalin, many of the building’s inhabitants wound up either in the Gulag or a mass grave in the ’30s and ’40s. Dark stuff.
I’d just started chapter 20, titled The Thought of Death, when I coughed hard.
Something leapt into my mouth, seemingly from just behind my sternum. Too surprised to get up and walk to a trashcan, I cupped my right hand and spit.
There lay a glob. I paused, trying to put a name on what I was seeing. In my cupped hand. Big, quivering, purplish. Blood.
I stared some more, then began assessing. For a few weeks, I’d felt a needling jab in one or two (or three?) spots in my left rib cage. I had dismissed the sensations as muscles strained by occasional sessions of push ups.
The jabs had multiplied the prior night. I’d woken a bunch of times, tossing and experimenting to find a position that would let me get back to sleep. I wondered how I might, in coming days, alter my push up regimen to work around these “strained rib cage muscles.”
Thinking more, as I stared at my cupped palm in the pale morning light, I realized that for months I’d been complaining to sundry friends about “slowing down.” Taking naps. Pruning my Saturday long runs from 10 miles… to 8 miles… to 6 miles… and walking, more and more, on those long runs, and sometimes even on short weekday runs.
What was to be done? I dismissed the impulse to rush to the emergency room on a Saturday morning as an amateur move. The ER would be packed with weekend warriors — hungover college kids with broken wrists, jittery parents cradling feverish kids, dry-mouthed old men troubled by their hangovers.
The longer I pondered, the more the idea jelled that the bloody cough, coming after months of rib jabs, naps and deceleration, was evidence of lung cancer.
Yep. This was lung cancer. I reasoned, further, that since my symptoms had been accumulating for months, I could wait to officially seek help until Monday. Anyway, who rushes to confirm a lung cancer self-diagnosis? Keep that box of knowledge closed a little longer so Schrodinger’s cat of optimism could continue to live… or at least not die. Who wants to be dragged along on the conveyor belt that leads into the clanging, ever-bright factory of modern medicine? Not me. I’d wait to go in Monday to see “a specialist.”
Meanwhile, I’d go for my morning run. Grinding out a few miles would show my body who was boss.
In fact, I almost died twice that day. That crazy day (lots more on that) launched me on six month a journey of investigating, reading, talking with doctors, reading, filling prescriptions, pouring over blood tests, comparing notes with friends, and, not least, digging through data from Fitbit, genetic tests and glucometers.
Along the way, I’ve learned that my experience — as big for me as it was tiny on the global scale of illness — hints at both the immensity of the promise and challenges of the coming epoch of personal health data.
On the one hand, personal health data is exponentially multiplying in quantity and quality, just as machine learning, fortuitously, becomes powerful enough to discern subtle patterns buried in and across all that data. We stand on the edge of a revolution in the prediction, diagnosis and coaching of physical and mental health.
On the other hand, numerous accreted barriers — institutional gridlock, data hoarding by care providers, corporate secrecy, data incompatibilities, regulations, regulators, guild self-interest, professional training, insurance reimbursement — block us from using that data for personal benefit.
The exact future of healthcare is a black box. But, using frameworks developed by academics seeking to understand prior technology-led revolutions, we can start to describe its location and edges.
What follows is a log of the six months — experiences, reading, testing, conversations — that led to the following conclusions:
Over the next 20 years, consumer health technology will become 10,000-times more powerful, usable, affordable and/or useful.
Spiraling feedback loops of consumer demand and innovation will push direct-to-consumer health solutions in directions that are unimaginable today.
Adoption by consumers will skyrocket. Bio-monitors — embedded in our eye glasses, toilet seats, phones, steering wheels, keyboards, shoes, guts— will be as ubiquitous and interwoven with our lives as clothing is today.
AI will detect patterns in the output data, transforming how we understand both diagnosis and treatment.
Most of today’s medical industry, which already lags state of the art innovations in technique and technology by an average 17 years, will be overwhelmed and then disintermediated.
By the year 2039, unless you’re pregnant or have a broken bone, Google will be medicine’s new waiting room. And AI, assisted by nurses and PAs, will do most doctoring.
Meanwhile, as pundits and Congress grumble about Facebook allowing Netflix to read and edit our private messages, hundreds of thousands of individuals will suffer because they, or their agents, can’t access and analyze their own data.
What’s ahead may be naive tech utopianism or fact-based, high-probability prognostication… or both. Your views welcome!
Who you gonna believe, this gadget or your lying eyes?
You live in an cocoon made of steel, glass, rubber and wood. Seduced by the simplicity of electric lights and herded by a tight schedule, you see only slivers of sunlight as you hustle to school or work each day.
You think your life is well lit. It’s not. You’re a terrible judge of light’s true intensity. You get just a fraction of the intense light required by your brain and body for optimal daily functioning.
If sunlight was food and metered with calories, you’d be diagnosed as an anorexic who subsists on spoonfuls of Splenda.
More immediately and tangibly, light starvation messes with your focus, sleep, and mood. The 2012 book Chronotherapy, by Michael Terman and Ian McMahan of Columbia and CUNY, summarizes the most obvious injuries caused by an off-kilter circadian clock: gloom and despair, excessive sleep, all-day sluggishness, inability to get work done, self-imposed isolation, and pervasive anxiety.
Trying to understand the intensity and timeline of my own light exposure, I recently started conducted a personal experiment. I wore a SunSprite, a 4 x 1.5 centimeter plastic light meter invented in 2014 by two Harvard professors. The $100 gadget neatly harnesses photovoltaic cells to both measure light and charge itself. The SunSprite clips to the neck of my shirt, getting roughly the same light exposure as my face.
Numerous studies have found that it takes 30 minutes of 10,000 lux light before noon to keep your circadian clock on tempo. (The average person’s circadian clock slides 10-15 minutes later every day, even without additional shoves from screens, caffeine, alcohol or Ritalin.)
Wearing the SunSprite, I’ve learned three things:
Unless I go out of my way —ie consciously staying outside — I don’t get enough bright light in the morning.
My perception of “bright” falls several orders of magnitude short of the clinical definition of bright.
Undershooting my morning light quota by 50% — getting just 15 rather than 30 minutes of bright light before noon — has a negative effect on my mood and alertness in the late afternoon.
Last Tuesday, May 22, was a good example of all three phenomena.
As the first chart below illustrates, after getting up at 7am, I drank coffee and read for an hour just a few feet from a big, west-facing window (medium upslope). I went for a ten minute run outside (peaks) with occassional overhead trees. Back home by 8.35am, I showered and ate breakfast, did some computer work sitting by same window, then drove thirty minutes to attend some meetings in a cafe with giant windows. At 11.30, I walked outside for a couple of minutes, then sat in a restaurant in a front table facing plate glass windows.
By my standards — and probably most people’s — this was a well lit morning. My various work sessions, all near big windows, felt brightly lit. The outdoor light felt at least two times brighter than the light indoors.
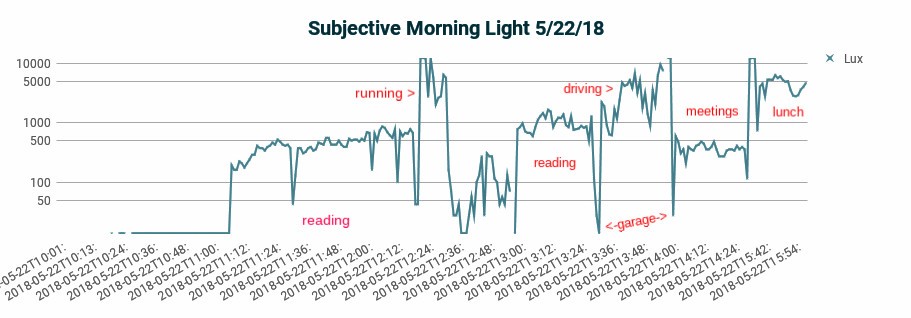
A log graph of the morning’s light exposure (below) conveys what my eye saw as it constantly adjusted to normalize my moment-by-moment reality.
Tuesday morning as I experienced it — lots of light! (Subtract 4 hours for EST.)
But, as you’ll see below, I was actually getting very little bright light. I didn’t realize this because real bright light — bright light as it’s clinically defined — is far brighter than what I get inside sitting by a window.
While humans describe light using just a handful of labels— dark, dim, decent, bright, or blinding — light actually comes in millions of shades. 1 lux is defined as the brightness of a candle spread over one square meter. Starlight is 0.002 lux. In clinical terms, bright light is 10,000 lux or more, which is easy enough to get if you’re outside. Even on a cloudy day, you may be getting 5,000 to 20,000 lux when walking or running beneath the open sky. A sunny day can be 100,000 lux or more. (To help treat Seasonal Affective Disorder (SAD), Amazon sells dozens of light boxes that generate 10,000 lux intensity at 1–3 feet. Here’s advice on buying a light box.)
Unfortunately, the light you experience inside a building or vehicle pales in absolute terms. At four feet, a reading lamp typically delivers just 25–75 lux. And while sitting three to five feet from a big window on a sunny day may feel feel bright, you’re often just getting 200–1,000 lux of exposure (assuming you’re not actually sitting in a patch of sun.) Light dims as a square of the distance of its source.
The disparity between light’s intensity as perceived by the human eye versus light’s actual intensity is the product homeostasis — a finely crafted survival mechanism that works constantly to make the present situation feel normal. Thousands of generations of evolution have trained the eye to lie to the brain. While the eye and body experience light on an absolute scale, the eye reports brightness using what amounts to a logarithmic scale, with each 10-fold change in intensity sensed as roughly an equal step, whether up or down. This sensory compression allows animals like us to use the same set of tools to maneuver in the sun-bleached desert or on a moonlit night.
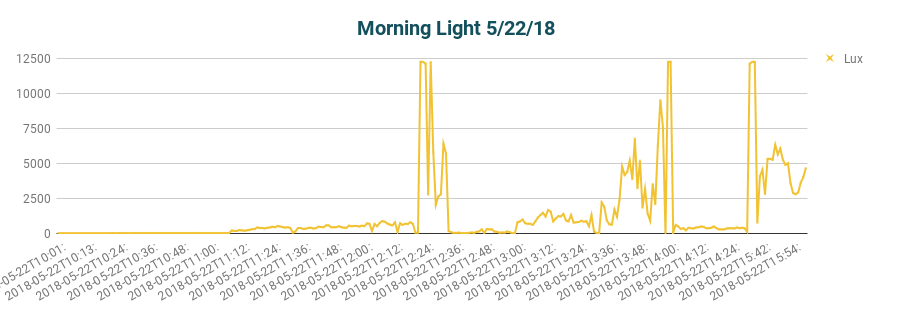
All of which means that Tuesday’s actual light intensity, as recorded by my SunSprite, was far more sporadic than I thought and, more importantly, did not add up to a minimum morning dose.
Actual exposure to light — a lot less than I thought. (Adjusted 4 hours.)
The SunSprite records light exposure once a minute, then aggregates any light exposure over 2,500 lux towards an overall goal of 30-minutes at 10,000 lux. By noon on this particular Tuesday morning, I had gotten less than halfway to the desired dose of 30 minutes of 10,000 light.
SunSprite half way to full 10k lux dosage at noon on a Tuesday.
Thinking about my meager 50% — effectively a UV fail — I realized that most of my Tuesdays fit the exact same pattern. Because I’m often rushing to various standing meeting commitments and have a pub run scheduled every Tuesday evening, I rarely bother to run more than a mile in the morning. Some mornings I skip the run. Most Tuesdays, I spend the rest of the morning inside — unlike most other mornings in my week, I don’t walk to and from a coffee shop.
In several subsequent Sunsprite tests on Tuesdays, I’ve consistently come up short as well… one Tuesday getting 6 units by noon and another getting 4 units. This week, it was cloudy and took me until past 1pm to get to 50%, despite a 20 minute morning run.
I’ve noticed over the last couple of years of this weekly work schedule that on Tuesdays I get REALLY dozy between 3 and 6pm. Some Tuesdays, I’ve actually resorted to 10 second naps at traffic lights. Indeed on this particular Tuesday afternoon, the one after the dim morning I charted above, I resorted to taking a nap from ~5 to 5.30pm to get up enough gumption to join the 6.30 pubrun.
This regular Tuesday afternoon slump has been particularly puzzling because my Monday nights are pretty tame… no beer, no late movies.
So if it’s true I usually don’t get enough sun on Tuesday mornings, what actual mechanics explain my drowsy Tuesday afternoons?
Three subject’s cycles averaged over six weeks: source.
In terms of simple hormones, the chemical gears that connect a solid dose of morning bright light to later well being are well-documented. First, a solid dose of bright morning light immediately suppresses doze-inducing melatonin and triggers a daylong buzz of energizing cortisol. Then, twelve to sixteen hours later, the day’s last circadian gear clicks, and a bath of melatonin pours over sparking neurons to bring sleep’s darkness.
That daily sequence is just a schematic, though, a single thread in a nearly infinite mesh of cascading metabolic pathways, neural connections, genetic expressions and health outcomes.
We may soon ask: is there anything in the body that is not ruled by the sun god, the circadian clock. Far beyond the media’s periodic expostulations about SAD, disruptive evening blue light, and vitamin D deficiencies, in recent years we’ve learned that:
After several centuries on the wane, the sun’s sphere of influence is growing again. As science’s tools become more powerful, it’s possible to connect dots across vast new scales of magnitude, ranging from the subatomic particle to the organism. Two dimensional snapshots like x-rays are giving way to 3D videos (time-lapsed fMRIs) and even 4D holograms. We’re abandoning the 20th century’s simplistic faith in mechanistic, single-path causalities. We now (and again) glimpse the human body’s gloriously multi-modal, multi-dimensional, fractally-complex Rube Goldbergness… all set in motion each morning by a tiny, spinning golden ball.
“Early to bed, early to rise, makes a man healthy, wealthy and wise” summed up sleep’s importance.
But Ben’s folk wisdom got good sleep’s cause and effect backward. New research shows that how well you sleep often depends on what you did that morning.
More than 100 government employees in five buildings across the US wore a Daysimeter pendant, a sensor that measures exposure to light frequencies unique to sunlight, for two weeks. The study found that workers who had significant morning sunlight exposure — whether through windows or directly — slept significantly better than workers who did not.
Versus workers who got little morning exposure to sunlight, the morning sunlight group fell asleep 27 minutes faster (spending just 18 minutes falling asleep versus 45 minutes — a lag called sleep latency) and got 19 minutes more sleep each night (355 minutes versus 336). The morning light group also did better on multiple other measures of sleep quality and had fewer symptoms of depression.
Run/walk in the sun
The new research sheds new light (sorry!) on 2014 research showing how sunlight multiplies exercise’s positive effect on sleep.
The study of 40 Korean men in their 20s found that exercising (walking or running) 30 minutes in the sun five days a week correlated with just 16 minutes of sleep latency, which beat both an exercise-only scenario (20 minutes sleep latency) and the no-exercise/ no-sun scenario (28 minutes).
Likewise, serum melatonin, the hormone that controls sleep, was significantly higher in the sun-exercise scenario (14.55 pg/ml) versus scenarios for only-exercise (12.8) and no-sun/no-exercise (9.45.) (It’s worth noting that, conversely, previous research showed that late-night exercise suppresses melatonin.)
Bottom line: if you want to sleep better, run in the morning sun.
——————–
Footnotes:
a) The Korean research also examined an ‘only sunshine’ scenario, which improved sleep versus the no sun/no exercise model, but did worse than exercise with or without sun. Unfortunately, it’s hard to compare the two studies — the Korean group was significantly younger (which correlates with better sleep quality) and no information was provided about time-of-day for the sun-exercise test case.
b) Sunlight is an antidote to a variety of illnesses and disorders — ranging from cancer to diabetes to MS to ADHD to TB to bipolar disorder to myopia — so it’s no surprise that sunlight is important for sleep too. (Surprise fact: jetlag can trigger psychosis.)
c) Both studies are based on relatively small samples (~100 and 40 people respectively) with various tantalizing disjunctions in the findings. (What a pity the Korean study didn’t highlight when the run-in-the-sun occured! And we don’t get any granularity on whether any of the office-workers exercised!) The good news: when more of us are armed (or wristed) with wearables — particularly when UV sensors are added to motion, heart rate and sleep stage detection — the available data will exponentiate.
d) Too bad, as prescriptions for sleeping pills multiply, we’re not seeing ads promoting morning runs. As Richard A. Friedman, a professor of clinical psychiatry and the director of the psychopharmacology clinic at the Weill Cornell Medical College observes, you can’t patent light therapy and doctors receive scant training about sleep. (Worse, they’re trained to ignore their own need for sleep.)